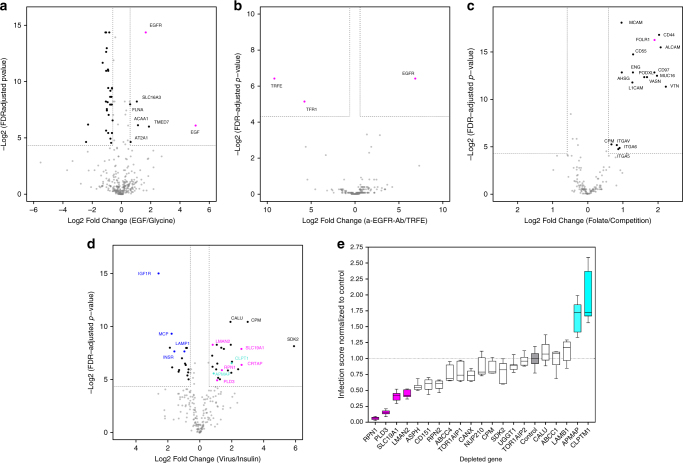
Fig. 2.
HATRIC-LRC identifies target receptors for ligands ranging from small molecules to intact viruses. All results of HATRIC-LRC experiments are presented in volcano plots, where fold changes of proteins are shown with their respective log-transformed, fold changes are also log transformed false-discovery rate (FDR)-adjusted p values. Target receptors are defined as proteins that have a fold change of greater than 1.5 compared to the control as well as a p value equal to or smaller than 0.05 (Benjamini–Hochberg method), corresponding to a target receptor window in the volcano plot that is framed by dotted lines. All experiments were performed in triplicates per condition, except for the H3N2, where quadruplicates were produced. a HATRIC-LRC with EGF on 20 million H-358 cells. In the negative control, HATRIC was quenched with glycine to map the off-target reaction of HATRIC on the same cell line. The ligand and the known target receptor are highlighted in magenta. b HATRIC-LRC experiments with EGF and TFRE were performed on 1 million MDA-MB-231 cells. In this experiment, two ligands with known receptors served as controls for each other to benchmark the ability to perform HATRIC-LRC with as little as 1 million cells. The ligands and known target receptors are highlighted in magenta. c Folate-based HATRIC-LRC was performed on 20 million folate-starved HeLa Kyoto cells per replicate. In the control, six-fold excess of free folate was used to compete with binding of folate-HATRIC. The target receptor FOLR1 is highlighted in magenta. d IAV-based HATRIC-LRC was performed on 20 million A549 lung adenocarcinoma cells per replicate. In the positive control, insulin was used as ligand, and insulin receptors were correctly identified. In the IAV-target receptor window, magenta-colored red dots highlight receptors that showed an inhibitory effect on IAV cell entry whereas turquoise dots blue highlight receptors that facilitated IAV cell entry in a siRNA-based knockdown experiment (Fig. 2e). e Effect of siRNA-mediated depletion of candidate receptors on IAV infection of A549 cells. Experiments were conducted in triplicates. Infection scores from siRNA-treated samples were normalized to control samples transfected with non-targeting siRNA (shown in gray). The data are presented as boxplots with whiskers from minimum to maximum values. Boxes extend from the 25th to 75th percentiles. The line in the middle of the boxes depicts the median. The dotted line on the plot shows the median of control group? (normalized to 1). Magenta and turquoise Red and green boxes highlight receptors that showed an inhibitory or facilitative effect on IAV cell entry (Magenta Red: infection score decreased by >50%, turquoise green: infection score increased by >50% upon gene depletion)

