Figure 2.
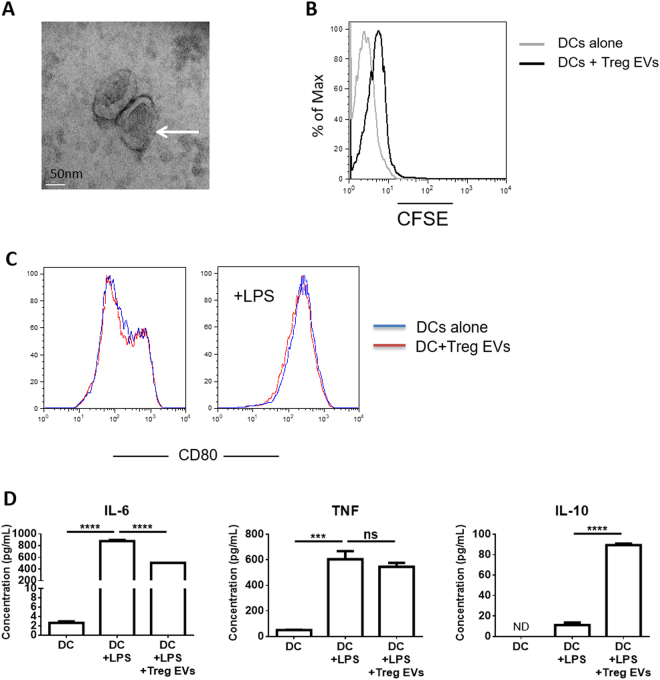
Murine Treg derived EVs are acquired by dendritic cells and alter cytokine production. (A) Electron micrograph image of EVs released from dTregs activated by plate-bound αCD3/CD28 antibodies isolated by ultracentrifugation. Scale bar indicates 50 nm. Representative image from 3 experiments is shown. (B) Treg cells were labelled with CFSE and activated by plate bound αCD3/CD28 antibodies for 24 hours. Supernatant was collected, cells and cell debris depleted and EVs isolated via ultracentrifugation (Treg EVs). BM-DCs were cultured alone or co-cultured with CFSE+ Treg EVs for 24 hours. Flow cytometry histogram plot showing CFSE expression levels of DCs cultured alone (grey) and DCs co-cultured with CFSE+ Treg EVs (black). Data is representative of 3 independent experiments. (C) BM-DCs were co-cultured alone (blue line) or with Treg derived EVs (red line) in the presence of 100 ng/mL LPS and CD80 expression was measured by flow cytometry after 24 hours. (D) IL-6, TNF and IL-10 cytokine production by BM-DC (DC+LPS), BM-DCs pre-treated with Treg EVs for 24 hours (DC + LPS + Treg EVs) and untreated BM-DCs (DCs) following LPS activated (24 hours) was assessed by cytometric bead array and flow cytometry. Data represents 2 independent experiments that were performed in technical triplicates, mean + SEM is shown. Statistical significance was determined using One-way ANOVA and Tukey’s multiple comparison test. ***p < 0.001, ****p < 0.0001, NS = not significant and ND = not determined.

