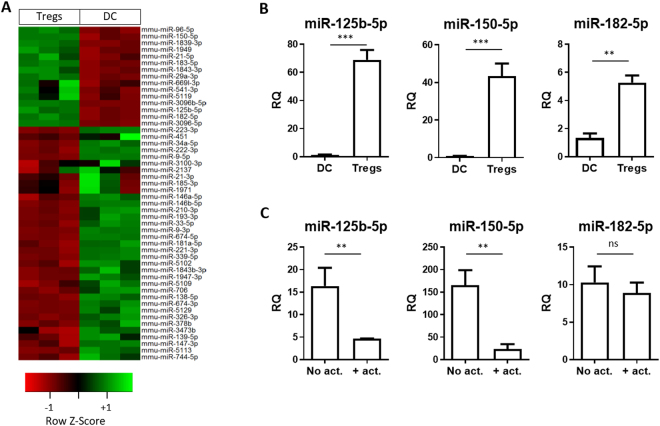
Figure 3.
Murine CD4+CD25+ dTregs express high levels of specific miRNAs compared to CD11c+ BM-DCs. (A) Microarray heat map diagram showing a two-way unsupervised hierarchical clustering of miRNAs by CD4+CD25+ dTregs and BM-DCs microRNA. (B) Bar graphs (mean+SEM) showing the relative quantity (RQ) of miR-125b-5p, miR-150-5p, and miR-182-5p in BM-DCs and dTregs, as measured by qPCR and normalised relative to RNU6-2 and SCARNA17. Data represents 2 individual experiments that were performed in duplicates. Statistical significance was determined using a two-tailed paired Student’s t-test where **p < 0.01 and ***p < 0.001. (C) Bar graphs (mean + SEM) showing the RQ of indicated miRNAs by Tregs immediately before (no act) and after (+act) polyclonal stimulation with anti-CD3/CD28 beads, as measured by qPCR and normalised relative to RNU6-2 and SCARNA17.

