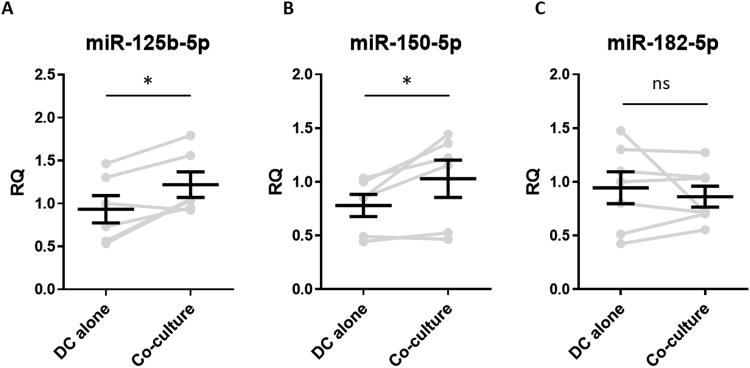
Figure 4.
BM-DCs obtain dTreg miRNAs following co-culture with Tregs. Bar graphs showing the relative quantity (RQ) of (A) miR-125b-5p, (B) miR-150-5p, and (C) miR-182-5p expressed by FACS sorted CD11c+CD4− DCs BM-DCs following co-culture with dTregs, as measured by qPCR and normalised relative to RNU6-2 and SCARNA17. DC-alone, represents BM-DCs cultured alone and FACS sorted. Data from 6 individual experiments is shown; each grey line represents an individual experiment and the pooled mean ± SEM of these experiments is shown in black. Statistical significance was determined using a two-tailed paired Student’s t-test where *p < 0.05. ns = not significant.

