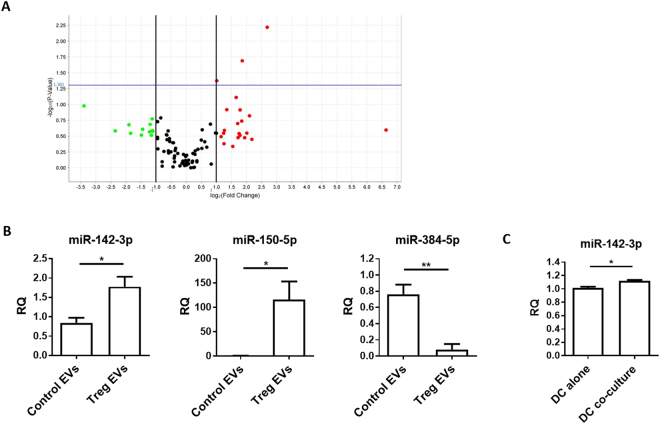
Figure 5.
Murine CD4+CD25+ Treg EVs contain different miRNA compared to control T cell EVs. (A) dTreg and control FoxP3- T cell EVs (n = 3 per group) isolated by ExoQuick-TC were lysed and total RNA was purified and assessed using NanoDrop™ spectrophotometer and Agilent 2100 Bioanalyser. EVs miRNA was reverse transcribed into cDNA and pre-amplified before miRNA detection using QuantStudio™ 12 K Flex Real-Time PCR System with the OpenArray® Platform. The volcano plot shows the relation between the p-value and the log fold change between FoxP3− T cell and Treg EV miRNA expression levels. The blue line indicates the inverse log10 of the p-value = 0.05. (B) Bar graphs (mean + SEM) showing the relative quantity of miR-142-3p, miR-150-5p, and miR-384-5p by control T cell EVs (Control EVs) and Treg EVs (Treg EVs) as measured by qPCR and normalised relative to RNU6-2. Data pooled from 3 individual experiments that were performed in triplicates. Statistical significance was determined using a two-tailed Student’s t-test where *p < 0.05 and **p < 0.01. (C) Bar graphs (mean+SEM) showing the relative quantity of miR-142-3p as measured by qPCR and normalised relative to RNU6-2 in FACs sorted CD11c+CD4–BM-DCs cultured alone (DC alone) or with dTregs (DC co-culture) overnight at a 1:1 ratio. Data pooled from 3 individual experiments that were performed in triplicates. Statistical significance was determined using a two-tailed paired Student’s t-test where *p < 0.05.

