Figure 6.

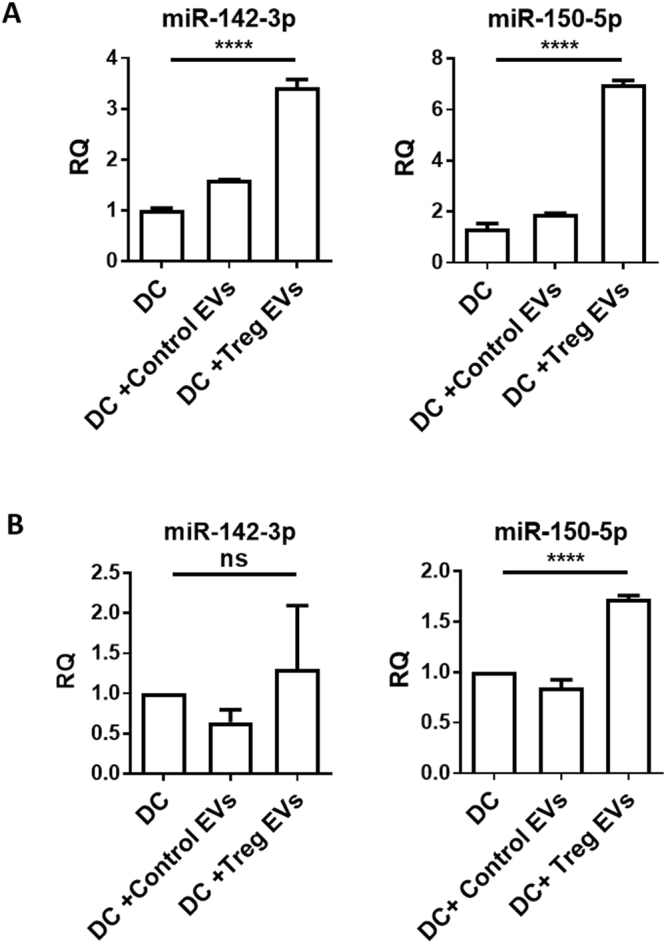
Treg EV derived miRNAs are transferred into DCs. (A) Bar graphs show relative quantity (RQ) of miR-142-3p and miR-150-5p in untreated B6 derived DCs (DC), control T cell EV-treated DCs (DC+Control EVs), or Treg EVs-treated DCs (DC+Treg EVs). DCs were treated with EVs for 24 hours, washed thoroughly and miRNA presence was measured by qPCR normalised to RNU6-2. Data represents mean+SEM pooled from 3 individual experiments that were performed in triplicates. Statistical significance was determined using One-way ANOVA and Tukey’s multiple comparison test, ****p < 0.0001. (B) Bar graphs show RQ of miR-142-3p and miR-150-5p in untreated Dicer deficient-derived DCs (DC), control T cell EVs-treated Dicer-deficient DCs (DC+Control EVs) or Treg EVs-treated Dicer-deficient DCs (DC+Treg EVs). Dicer-deficient DCs were treated with EVs for 24 hours, washed thoroughly and miRNA presence was measured by qPCR and normalised to RNU6-2. Data shown is mean+SEM representative of 2 experiments that were performed in technical triplicates. Statistical significance was determined using One-way ANOVA and Tukey’s multiple comparison test, ****p < 0.0001 and ns = not significant.
