Fig. 6.
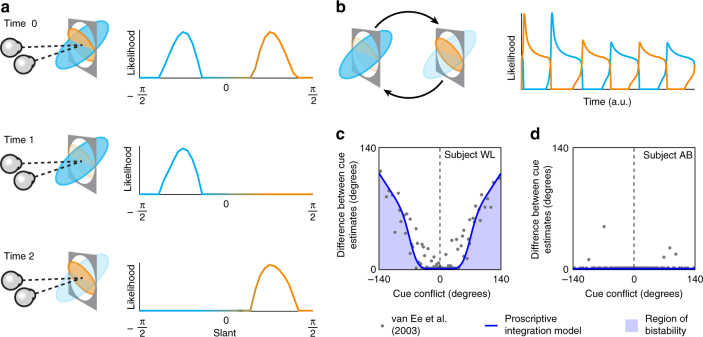
Simulating perceptual rivalry with the proscriptive integration model. a Perceptual rivalry produced with the model: time 0 indicates the likelihood function represented in the output layer when two incongruent cues of equal reliability are simulated. Mutual inhibition between neuronal representations (and internal noise) results in dominance at time 1. Adaptation of the units representing the dominant representation results in its gradual decay and subsequent re-emergence of the non-dominant representation at time 2. b Likelihood of the simulated slant angles as a function of time, showing the typical dynamics of perceptual alternation. c Psychophysical data extracted from van Ee et al.23. This shows the difference between cue estimates as a function of cue conflict (see Online Methods for detailed description of data extraction and reanalysis). The blue line is a fit of the proscriptive model and the shaded area indicates the experience of perceptual rivalry. d Depicts an example subject from van Ee et al.23 in which one cue dominates perception and rivalry is not experienced. The blue line (barely visible) shows the fit of the proscriptive model where the two cues are ascribed very different reliabilites such that one completely dominates the other

