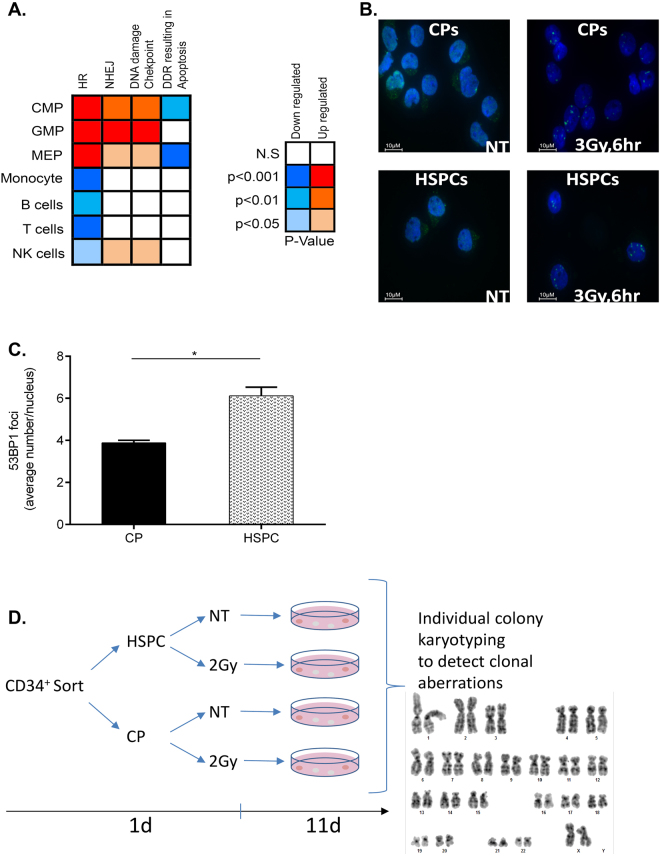
Figure 5.
DNA repair and DDR gene expression, DSB marker and genome stability analyses. (A) left panel: relative expression of transcripts related to DNA repair, DDR checkpoint and apoptosis pathways in CPs (CMP, GMP and MEP) and mature blood-derived cells (B, T and NK) in comparison to HSPCs colored accordingly to the significance of the changes. right panel: color scheme description with blue colors for decreased expression and red colors indicative of increased expression relative to HSPCs along with the corresponding p values. (B) CD34+ cells were sorted into HSPC and CP fractions. Representative immunofluorescence staining visualized for 53BP1 (green) and DNA (blue) in HSPCs and CPs 6 hr after 3 Gy IR. (C) Average number of 53BP1 foci per cell in CPs and HSPCs. n = 3 experiments; Represented are mean values ± SD; *p < 0.05. At least 100 nuclei were analyzed in each experiment. (D) Workflow for the karyotype analysis of irradiated HSPCs and CPs. Freshly isolated CD34+ cells were sorted for HSPC and CP fractions, exposed or not to IR (2 Gy) and then plated at low density in methylcellulose to allow colony formation. Individual colonies were isolated for metaphase preparation and karyotype analysis (Table 1, and Supplementary Table 1).

