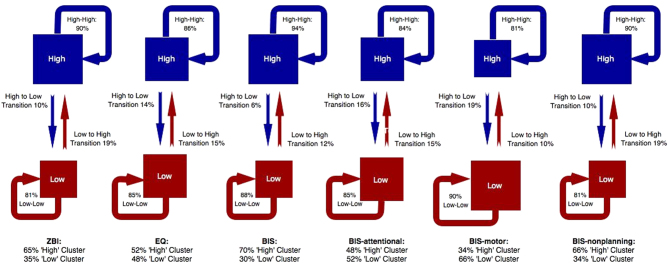
Fig. 3.
Hidden Markov modelling of cluster assignment and transition probabilities for the caregiver-rated variables ZBI, caregiver-EQ and caregiver-BIS (plus subscales). For each variable, the posterior probability of cluster assignment (‘high’ versus ‘low’) is denoted below the variable heading. Transition probabilities for each cluster are represented by arrows. For example, for ZBI, 65% of the sample are assigned to the ‘high’ cluster. Amongst that cluster, there is only a 10% transition probability from ‘high’ to ‘low’, indicating relative stability of ‘high’ cluster assignment for that variable. BIS Barratt Impulsiveness Scale, EQ Empathy Quotient, ZBI Zarit Burden Inventory

