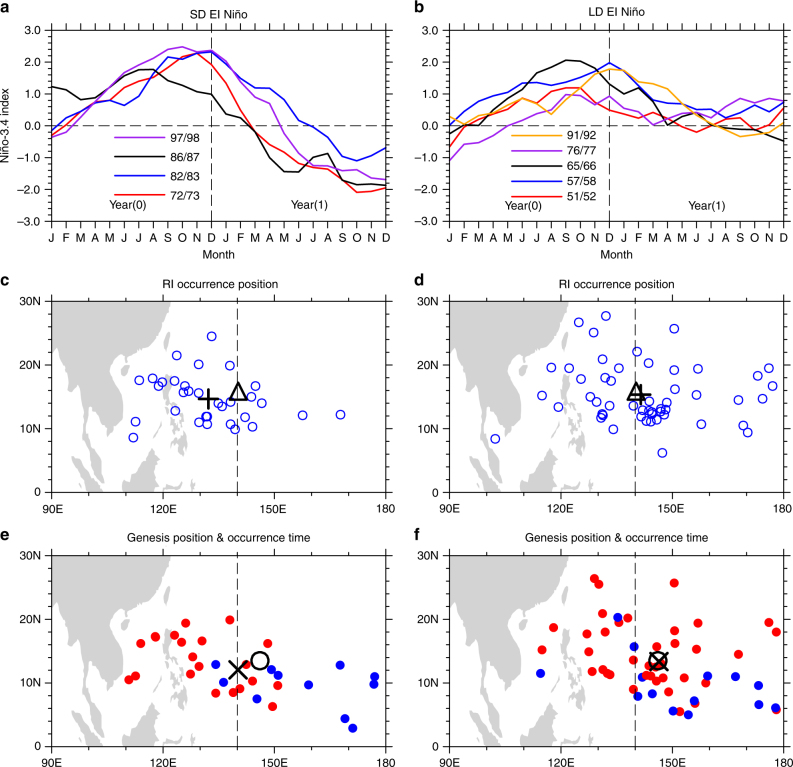
Fig. 1.
El Niño durations and their impacts on the tropical cyclone rapid intensification. The time series of monthly mean Niño-3.4 indices based on ERSST reanalysis dataset from January of the El Niño developing year to December of the decaying year for a short duration (SD) El Niño events and b long duration (LD) El Niño events. El Niño developing and decaying years are denoted by year(0) and year(1), respectively. The composite tropical cyclone (TC) rapid intensification (RI) occurrence positions from JTWC best-track dataset for c SD and d LD El Niño events are shown as blue circles. The triangles in c, d indicate the mean RI occurrence position for neutral years. The crosses in c, d indicate the mean RI occurrence positions for SD and LD El Niño events, respectively. The composite RI TC genesis positions for e SD and f LD El Niño events are shown as colored dots. The red (blue) dots indicate the RI occurrence time is within (beyond) 3 days of TC genesis. The circles in e, f indicate the mean RI TC genesis position for neutral years. The x-marks in e, f indicate the mean RI TC genesis position for SD and LD El Niño events, respectively. The dashed lines in c–f indicate the 140°E longitude

