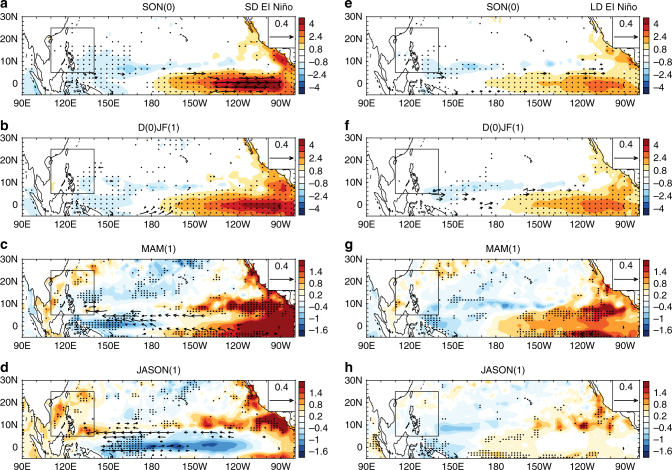
Fig. 4.
Evolution of the ocean heat content and upper ocean current for the short duration and long duration El Niño events. Composite anomalies of mean upper ocean (5–100 m) temperature (shading, units: K) and currents (vectors, units: m s–1) from SODA reanalysis dataset for a September(0)–November(0), b December(0)–February(1), c March(1)–May(1), and d July(1)–November(1) during short duration El Niño events. e–h as in a–d, but for long duration El Niño events. (0) and (1) indicate the months in El Niño developing and decaying years, respectively. Black boxes indicate the South China Sea and the Western Philippine Sea region. The stippled areas indicate the values are statistically significant at the 95% confidence level. The vectors only show the currents anomalies exceeding the 95% confidence level

