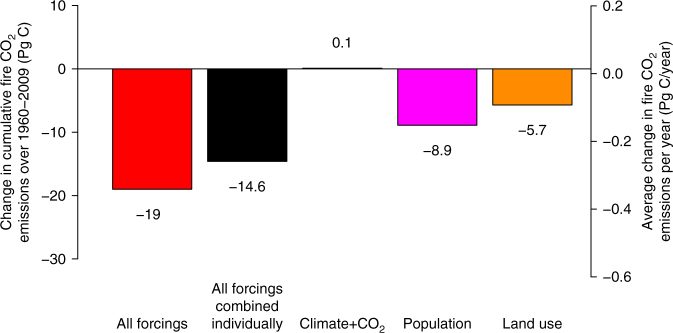
Fig. 4.
Effect of changes in forcings on simulated cumulative fire CO2 emissions over the 1960–2009 period. The secondary y-axis on the right hand side is equal to the cumulative amount divided by 50 (equal to number of years in the 1960–2009 period). For example, the red bar shows the cumulative change in fire emissions from the simulation with all forcings. Since the number is negative it implies that over the 1960–2009 period cumulatively fire emissions decreased by 19 Pg C or equivalently 0.38 Pg C/yr when read on the secondary y-axis. However, reduced fire emissions do not necessarily lead to an enhanced land carbon sink as discussed in the text. The effect of climate and CO2 is combined into a single value since it is very small overall. The individual contributions, calculated from simulations with individual forcings, do not sum together to yield the same decrease in cumulative fire CO2 emissions as the simulation with all forcings because of the spatial correlations between different forcings (e.g. crop area increase correlates positively with population increases) but also the non-linear response of the model to individual forcings

