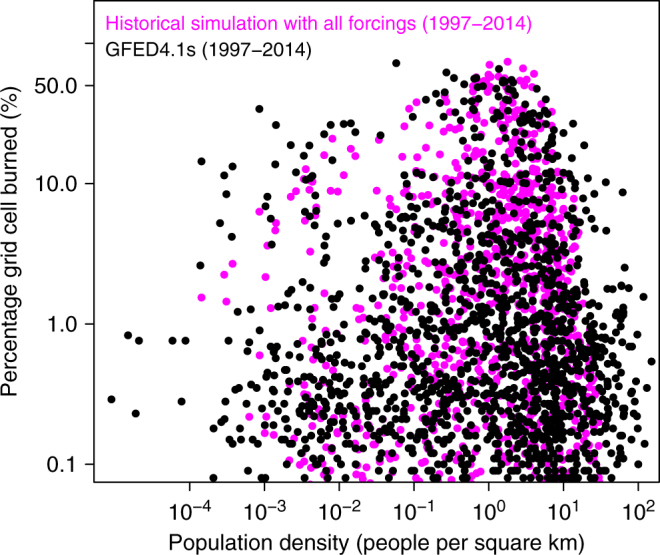
Fig. 5.

The emergent behavior between area burned and population density. Population density and percentage area burned are both plotted on log scale for easy visualization of their behavior at their low values. Comparison is made between simulated (historical simulation with all forcings) and satellite-based (GFED4.1s) values of area burned. The model successfully reproduces the unimodal relationship between population density and area burned which peaks at around 20 people/km2
