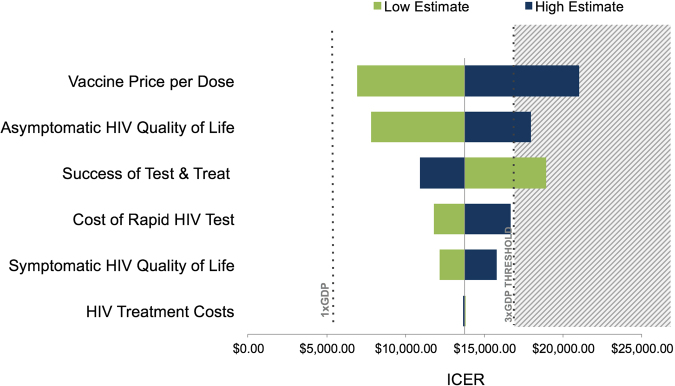
Figure 4.
HIV vaccine cost-effectiveness: Tornado plot of univariate sensitivity analysis. Incremental cost-effectiveness ratios (ICERs) for HIV vaccinations were calculated with 2 values for each parameter: the lowest in the range (green) and highest in the range (dark blue) while the rest of the parameters were fixed at their base-case (70% vaccine efficacy, 20% coverage) values. The mean base-case ICER is represented by the solid vertical line. The region with the grey background represents vaccinations that are not cost-effective (using a 3 × GDP/capita threshold).

