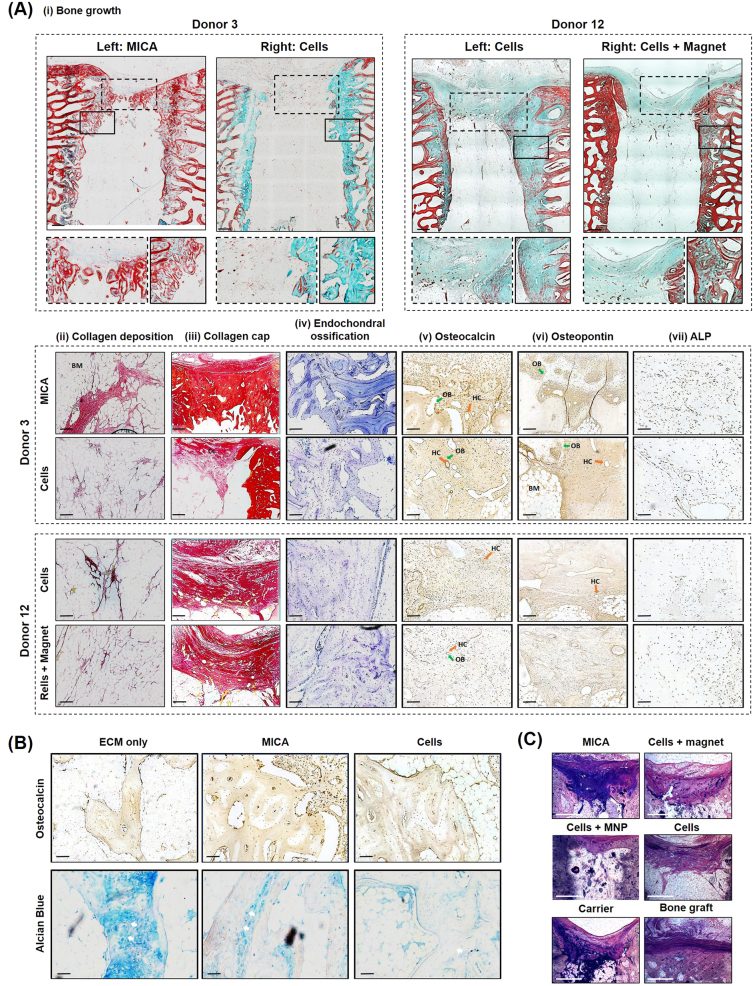
Fig. 6.
Histological evaluation of repair at 13 weeks. a Representative images from; Donor 3 (MICA animal) treated with MICA (left defect) and cells only (right defect) and Donor 12 (MICA-control animal) treated with cells only (left defect) and cells + magnet (right defect). Histological staining; a, i Masson-Goldner trichrome staining identifying new bone callus in green, osteoid steams in red and focused on bone outgrowth over the top of the defect and along the peripheral edges (inserts). a, ii and a, iii Picrosirius red staining of collagen rich structures in the central and proximal regions of each defect respectively. a, iv Toluidine blue staining identifying cartilage-like tissues rich in proteoglycans (indicative of bone growth via the endochondral ossification route) in purple. a, v Osteocalcin a, vi osteopontin and a, vii ALP (alkaline phosphatase) immuno-histochemical (IHC) staining at the proximal region of each defect. b Representative ECM-carrier, MICA and cell only sections stained for Alcian blue and Osteocalcin IHC demonstrating areas of cartilage like tissue (Alcian blue) and areas of mineralised tissue (osteocalcin). c Representative calcified sections from each group stained with paragon and toluidine blue staining; new bone growth is identified by light pink staining while fibrous tissue is stained deep purple. Scale bar represents 500 µm (a, i, a, iii),100 µm (a, ii, a, iv, a, v, a, vi, a, vii, b) or 1500 µm (c). Green arrow (OB); osteoblasts, orange arrow (HC); Haversian Canals, white arrows; hypertrophic chondrocytes, BM; Bone marrow. For further information on the anatomical location of each section, please refer to supplementary information, Fig. 3

