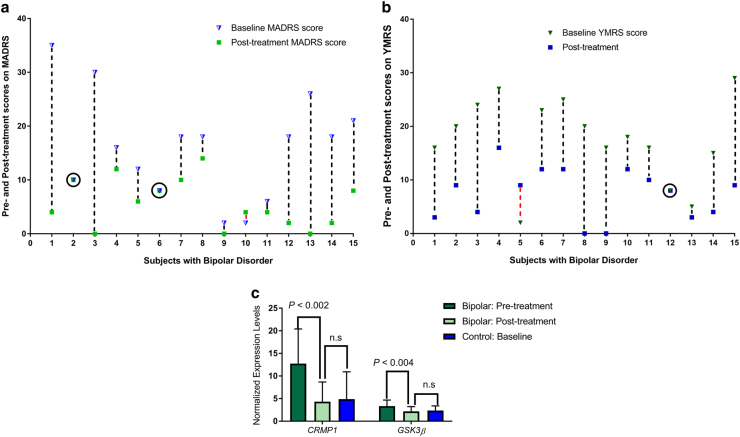
Fig. 2. Lithium-Associated Changes in Affective Symptoms and in Gene Transcriptions.
a Individual-level changes in the severity of depression based on scores on the MADRS scale obtained on each BD subject at baseline and after 6 weeks of lithium therapy. Baseline MADRS scores are represented in Blue triangles, post-treatment scores are represented in Green squares, and the dash lines between scores represent the differences between pre- and post-treatment depression severity. Apart from onesubject (the Red dash), all subjects experienced improved symptoms. b Individual-level changes in severity of mania/hypomania based on scores on the YMRS scale obtained on each BD subject at baseline and after 6 weeks of lithium therapy. Baseline YMRS scores are represented in Green triangles, post-treatment scores are represented in Blue squares, and the dash lines between scores represent the differences between pre- and post-treatment depression severity. Red dash indicates worsening severity. Note: both (2a and 2b) illustrate considerable improvements in mood symptoms, but also highlight ceiling effects for people with low pre-treatment levels in MADRS or YMRS scores. The degree of change is dependent on the starting (i.e. baseline) scores, which necessitates use of repeat-measures approach to statistical analysis of treatment effects. c Pre- and Post-treatment normalized mRNA levels of CRMP1 and GSK3β among BD subjects and controls who received 6 weeks of lithium therapy. Among BD subjects, mRNA levels were significantly downregulated post-treatment. Pre- and post-treatment differences in transcriptions were not observed for controls

