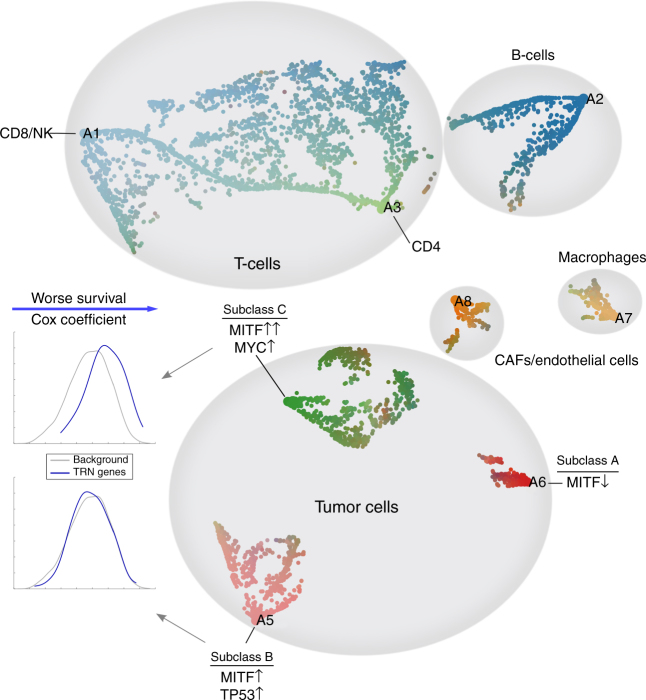
Fig. 6.
A continuous view on the space of primary functions in the Melanoma dataset. Each archetype, representing a primary function, is illustrated using a textual label (A1–A8). Each small dot represents a cell. Cells are color-coded based on their proximity to archetypes. All data points are projected onto a 2D plane using a carefully initialized Stochastic Neighbor Embedding method (SNE, see Supplementary Note 10). The functional space of cells exhibit a mix of cell state continuum, such as in the case of T-cells, as well as discrete cell types. Three subclasses of melanoma tumor cells are marked accordingly in the map. Subclasses B and C are both MITF-associated. Among them, genes that participate in the transcriptional regulatory network (TRN) for subclass B do not show any significant shift in Cox coefficient, compared to the background of all genes, whereas in subclass C they do. In this sense, high-expression of genes in the TRN of subclass C is significantly associated with worse outcome in the melanoma patients

