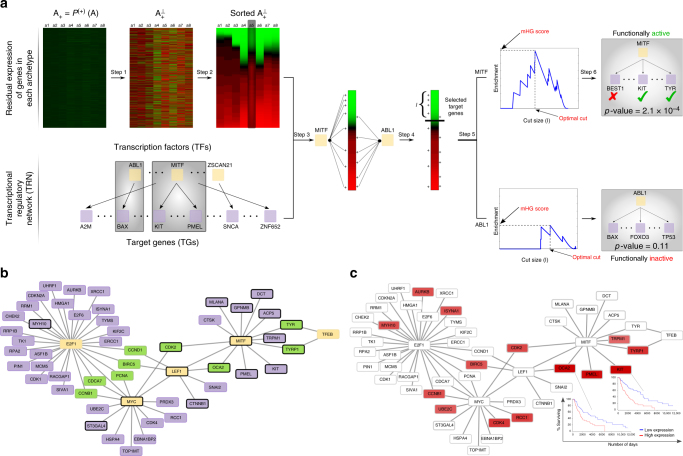
Fig. 7.
The transcriptional regulatory network (TRN) for MITF-associated Melanoma patients highlights a number of genes that have not previously been associated with Melanoma—along with some known markers. a Main steps involved in the construction of archetype-specific TRNs: (1) Orthogonalize archetypes with respect to each other, (2) Sort genes based on their residual expression, (3) Map gene targets for TFs to the sorted list genes, (4) Enrichment analysis for fixed cut size l, (5) Find optimal cut size and compute minimum HyperGeometric (mHG) score, and (6) Assess significance of the mHG score using Dynamic Programming (DP). b A subset of the TRN of subclass A induced by using only the most significant TFs. The yellow nodes are transcription factors (TF), the purple nodes are target genes (TG), and green nodes are target genes that bridge different TFs. Genes marked with black border are known to be involved in the proliferative subclass of Melanoma. c The TRN of subclass A with genes color-coded according to their Cox coefficient. Red genes are the ones whose high expression is associated with worse outcome, and brightness of the color relates to the severity of the outcome. Kaplan–Meier plots for two of the targets of MITF that are unique to subclass A, but not subclass C are shown on the plot

