Fig. 1.
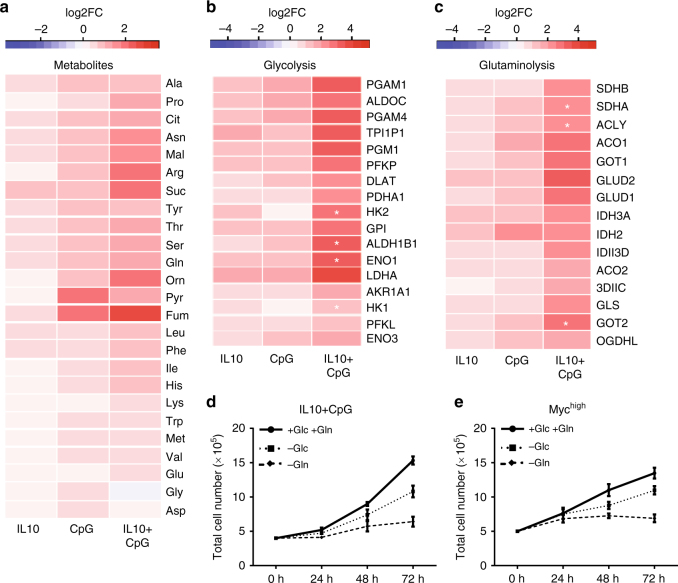
Activation of cell metabolism and global gene expression by combined stimulation of P493-6 cells with IL10 and CpG. a Heat map of changes in intracellular metabolite concentrations depicted as Log2FC after IL10 and/or CpG stimulation of P493-6 MYClow cells in relation to unstimulated cells. Heat map of gene expression changes associated with b glycolysis (KEGG-term) and c glutaminolysis (KEGG-term), respectively, after IL10 and/or CpG stimulation of P493-6 MYClow cells presented as Log2FC. Mean of three independent experiments is shown in all heat maps. Effects on gene expression were analyzed by linear regression and p-values for the IL10:CpG interaction terms were calculated (adjusted by Benjamini–Hochberg). Positive synergistic interactions are marked with a star (*p < 0.05). Relative cell counts of d IL10 + CpG-stimulated P493-6 MYClow cells and e unstimulated P493-6 MYChigh cells grown in media with and without either glucose (–Glc) or glutamine (–Gln). Mean ± SD of three independent experiments are given

