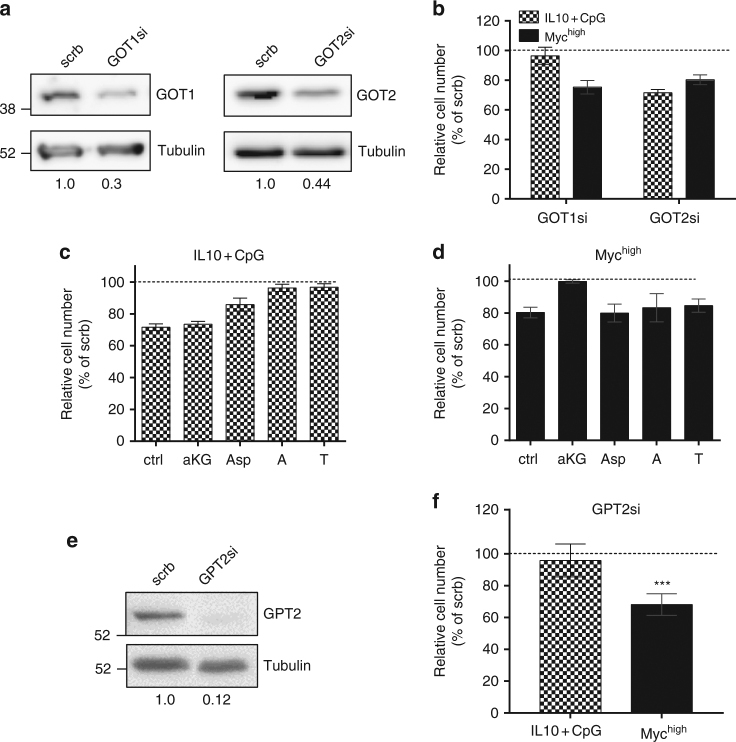
Fig. 4.
GOT2 supports the proliferation of IL10 + CpG-stimulated and MYC-overexpressing cells. a Transient knockdown of GOT1 and GOT2 in P493-6 cells was performed by siRNA transfection. Knockdown efficiencies (GOT*/tubulin) relative to scrb control are provided under the images. b Relative cell numbers of IL10 + CpG-stimulated P493-6 MYClow and P493-6 MYChigh after GOT1 or GOT2 knockdown depicted in a. Relative cell numbers of c IL10 + CpG-stimulated P493-6 MYClow and d unstimulated P493-6 MYChigh cells after GOT2 knockdown and indicated α-KG, Asp, A or T addition as described in Fig. 2. e Transient knockdown of GPT2 in P493-6 cells performed by siRNA transfection. Knockdown efficiencies (GPT2/tubulin) relative to scrb control are provided under the images. f Relative cell numbers of IL10 + CpG-stimulated P493-6 MYClow and P493-6 MYChigh cells after GPT2 knockdown as depicted in e. All experiments were performed in triplicates. For b–d and f, error bars represent mean ± SD of three independent experiments and results from Bonferroni post hoc tests on a one-way ANOVA are given (*p < 0.05, **p < 0.01, ***p < 0.001)

