Fig. 6.
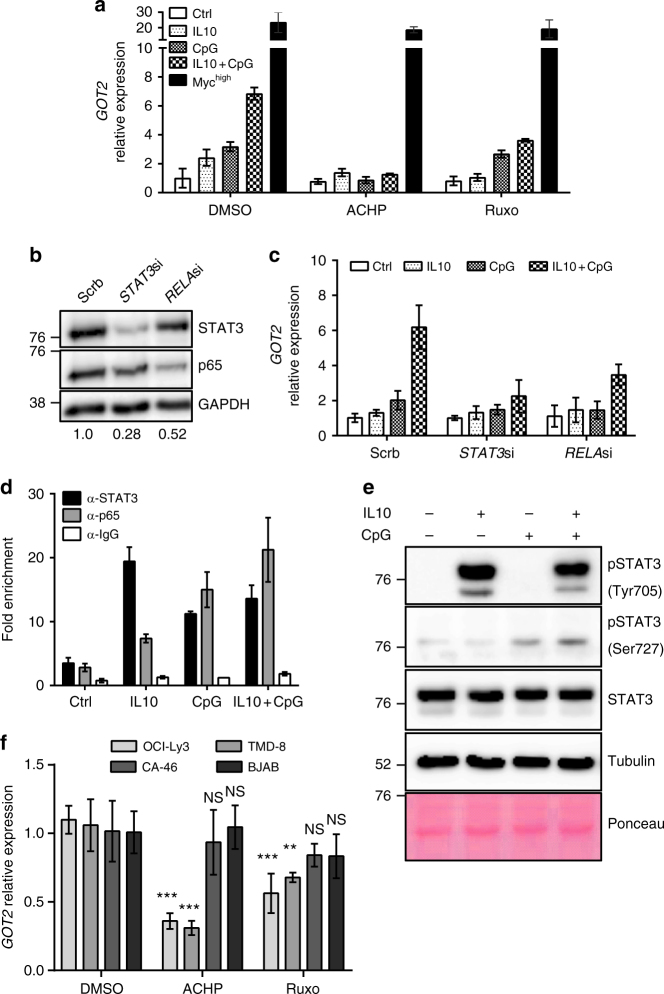
GOT2 expression in B-cells is up-regulated by NF-κB/STAT3 activation or MYC. a GOT2 mRNA expression in 24h-stimulated P493-6 MYClow and unstimulated P493-6 MYChigh cells after inhibition of NF-κB signalling by ACHP or JAK/STAT signalling by Ruxolitinib. b Representative immunoblot of STAT3 and p65 protein levels 24 h after STAT3 (STAT3si) or RELA siRNA (RELAsi) transfection of P493-6 cells. Knockdown efficiencies (protein/GAPDH) relative to scrb control are presented under the images. c GOT2 mRNA expression in 24h-stimulated P493-6 MYClow cells after siRNA transfection shown in b. d Chromatin immunoprecipitation of STAT3 and p65 1 h after stimulation of P493-6 MYClow cells. Displayed are average qPCR results and technical errors (SD) of the GOT2 promoter (– 20 bp) from a representative stimulation out of three. Enrichment was calculated relative to an inactive control region (PRAME). e Full tyrosine and serine phosphorylation of STAT3 is only achieved after IL10 + CpG costimulation as revealed by immunoblot analysis. Cells were stimulated with IL10, CpG or both for 30 min. f GOT2 mRNA expression of TMD-8 and OCI-Ly3 cells in comparison with BJAB and CA-46 cells 24 h after ACHP or rRuxolitinib treatment. For additional details about the used cell lines also refer to Supplementary Fig. 7a. With the exception of d, all values are given as mean ± SD of three independent replicates. Results from Bonferroni post hoc test on a two-way ANOVA are presented (***p < 0.001, **p < 0.01)

