Fig. 7.
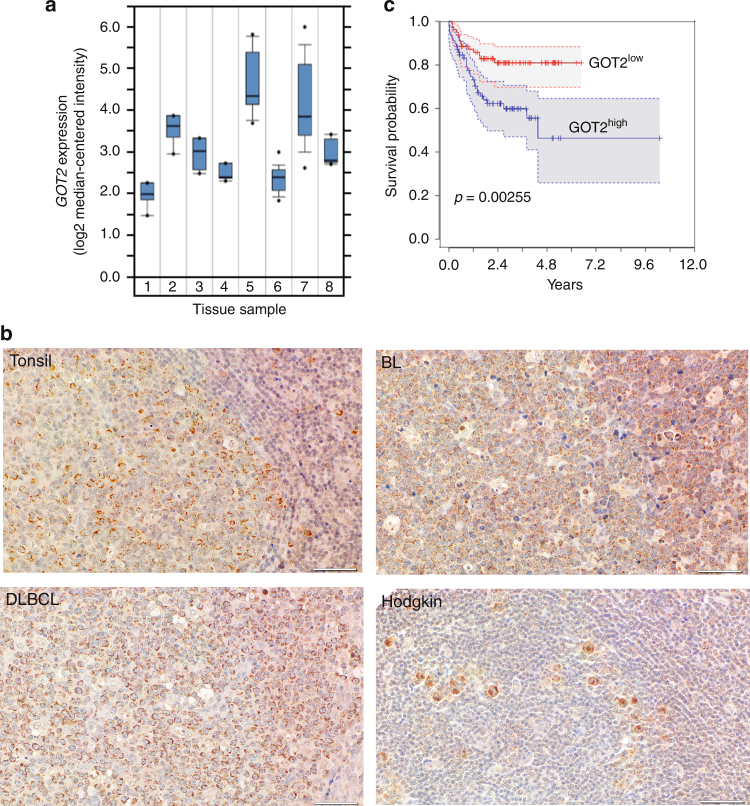
GOT2 is overexpressed in lymphoma subtypes and correlates with worse overall survival in DLBCL patients. a Microarray gene expression data of GOT2 obtained at ONCOMINE68,69. Expression of normal B-cell controls (1 = B lymphocytes (n = 5), 2 = centroblasts (n = 5), 3 = memory B -cells (n = 5), 4 = naive pre-germinal B- cells (n = 5)), and lymphoma samples (5 = BL (n = 17), 6 = CLL (n = 34), 7 = DLBCL (n = 32), and 8 = MCL (n = 8)) are given. Boxes are showing median (middle line), upper and lower quantile (edges), minimum and maximum (bars), and outliners (dots). b Immunohistological staining of GOT2 in representative samples of tonsils, BLs, DLBCLs, and HLs (see also Table 1). The scale bar represents 50 µm. In Supplementary Fig. 12, a corresponding GOT2 staining for the liver, lung, muscles, and skin is provided showing a homogeneous GOT2 expression in hepatocytes. c Kaplan–Meier curves of DLBCL patients (n = 157) treated with R-CHOP18. Patients were grouped according to their GOT2 expression relative to the median of the group (high > median and low ≤ median). Additional details using a Cox proportional hazards regression model to estimate the clinical outcome of patients with DLBCL in relation to the expression of GOT2 are presented within Supplementary Table 1

