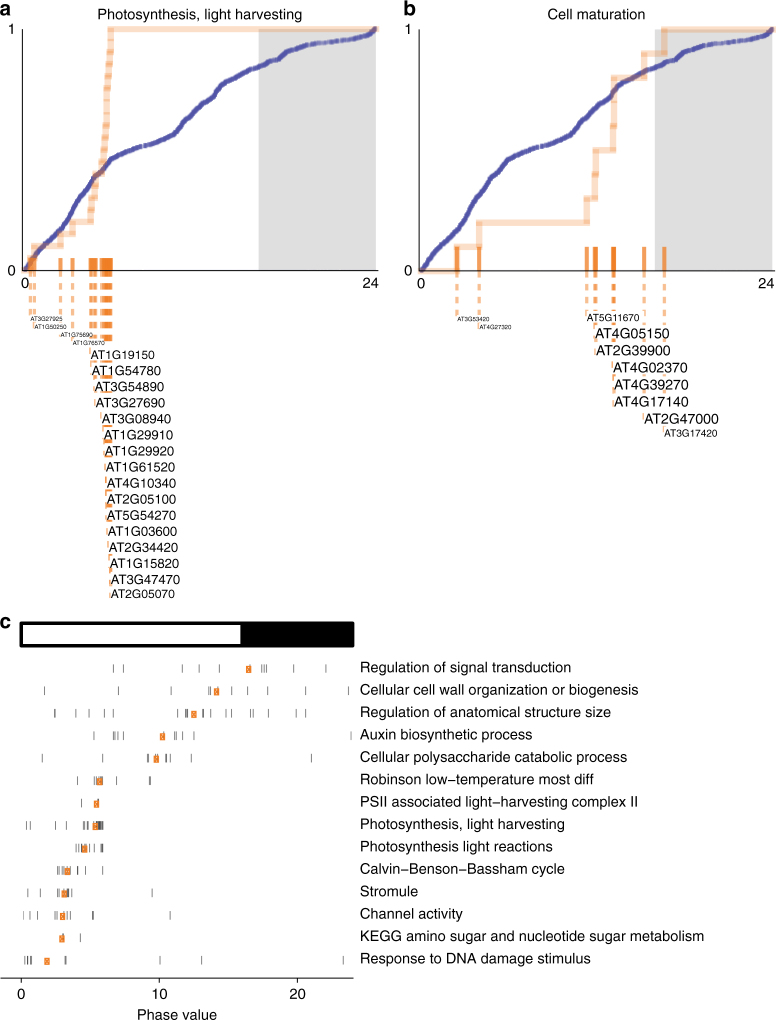
Fig. 4.
Phase set enrichment analysis of the genes with oscillating TCR. Cumulative distributions (to 100%) of the genes associated with a Photosynthesis, light harvesting and b Cell maturation categories (orange). The cumulative distributions are significantly different from the background (1453 genes with TCR oscillation, blue) based on the Kuiper test (q < 0.05). c Phase values of the genes involved in specific pathways. Each vertical bar represents a gene phase value which is aligned with the x-axis. Orange points represent the median phase values of the genes for each category

