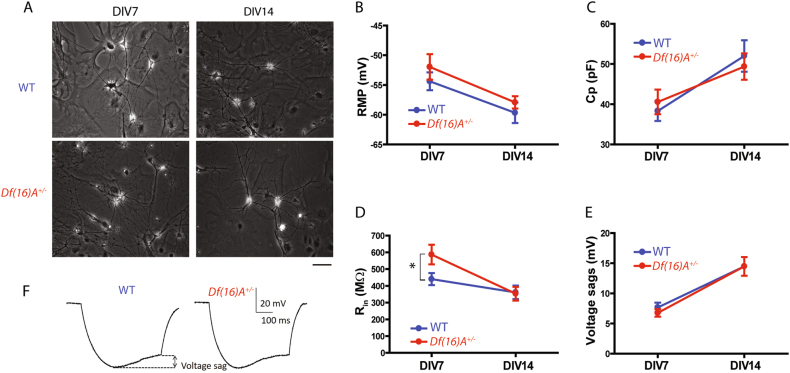
Fig. 1. Passive membrane properties of WT and Df(16)A+/− cortical neurons.
a Bright field images of WT and Df(16)A+/− cortical neurons co-cultured with astrocytes at DIV7 and DIV14. Scale bar = 50 µm. b Quantitative data of resting membrane potential (RMP) measured in WT and Df(16)A+/− cortical neurons at DIV7 and DIV14, respectively. There was no significant difference between genotypes at both time points. c Quantitative data of cell capacitance (Cp) in WT and Df(16)A+/− cortical neurons at DIV7 and DIV14, respectively. There was no significant difference between genotypes at both time points. d Quantitative data of input resistance (Rin) in WT and Df(16)A+/− cortical neurons at DIV7 and DIV14, respectively. Df(16)A+/− cortical neurons showed significant higher Rin than that of WT neurons at DIV7 (t test, *p < 0.05). e Quantitative data of voltage sags caused by HCN-mediated currents in WT and Df(16)A+/− cortical neurons at DIV7 and DIV14, respectively. There was no significant difference between genotypes at both time points. f Sample traces of HCN-caused voltage sags in WT and Df(16)A+/− cortical neurons at DIV7. In the presence of HCN-mediated currents, a negative current step (hyperpolarizing the cell membrane to −150 mV) induced a depolarizing voltage sag (arrows, left panel)

