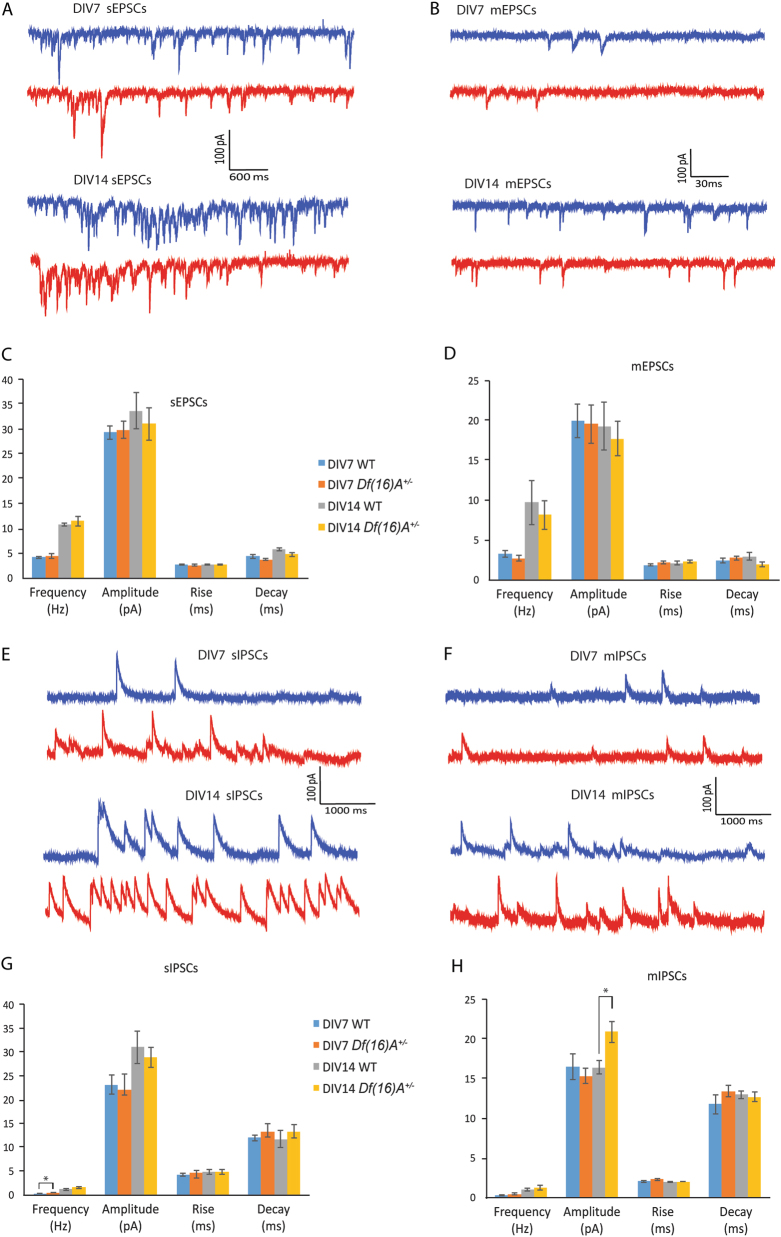
Fig. 3. Synaptic properties of WT and Df(16)A+/− cortical neurons.
a Sample traces of sEPSCs from WT (blue trace) and Df(16)A+/− (red trace) neurons at DIV7 (upper panel) and DIV14 (lower panel), respectively. Scale bar as shown in inset. b Sample traces of mEPSCs from WT (blue trace) and Df(16)A+/− (red trace) neurons at DIV7 (upper panel) and DIV14 (lower panel), respectively. Scale bar as shown in inset. c Bar graphs of sEPSCs of WT and Df(16)A+/− cortical neurons at DIV7 and DIV14. No significant difference was observed between genotypes. d Bar graphs of mEPSCs of WT and Df(16)A+/− cortical neurons at DIV7 and DIV14. No significant difference was observed between genotypes. e Sample traces of sIPSCs from WT (blue trace) and Df(16)A+/− (red trace) neurons at DIV7 (upper panel) and DIV14 (lower panel), respectively. Scale bar as shown in inset. f Sample traces of mIPSCs from WT (blue trace) and Df(16)A+/− (red trace) neurons at DIV7 (upper panel) and DIV14 (lower panel), respectively. Scale bar as shown in inset. g Bar graphs of sIPSCs of WT and Df(16)A+/− cortical neurons at DIV7 and DIV14. Df(16)A+/− cortical neurons showed significant increase in frequency at DIV7 compared to WT neurons (t test, *p < 0.05). h Bar graphs of mIPSCs of WT and Df(16)A+/− cortical neurons at DIV7 and DIV14. Df(16)A+/− cortical neurons showed significant increase in amplitude at DIV14 compared to WT neurons (t test, *p < 0.05)

