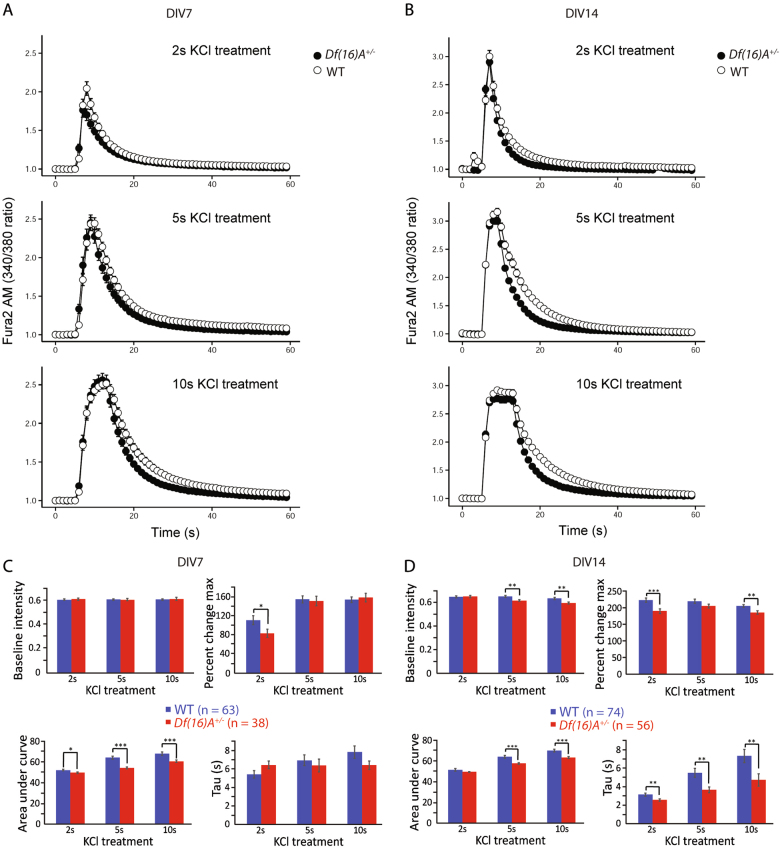
Fig. 4. Calcium imaging of WT and Df(16)A+/− cortical neurons.
a Graph shows voltage-gated calcium responses in WT (open circles) and Df(16)A+/− (closed circles) cortical neurons at DIV7 by exposing to 30 mM KCl for 2 s (top panel), 5 s (middle panel), and 10 s (bottom panel). b Graph shows voltage-gated calcium responses in WT (open circles) and Df(16)A+/− (closed circles) cortical neurons at DIV14 by exposing to 30 mM KCl for 2 s (top panel), 5 s (middle panel), and 10 s (bottom panel). Neurons were loaded with Fura-2. Data were plotted as the ratio of fluorescence intensity excited at 340 and 380 nm vs. time and the values were normalized to the averaged baseline level. c Summary data of calcium imaging for WT and Df(16)A+/− cortical neurons at DIV7. Compared to WT neurons, Df(16)A+/− neuros showed significantly lower peak value of calcium elevation at 2 s and smaller AUC under all treatments. d Summary data of calcium imaging for WT and Df(16)A+/− cortical neurons at DIV14. Significantly decreased basal calcium level, lower peak values, smaller AUC, and faster recovery were observed for Df(16)A+/− neurons compared to WT ones

