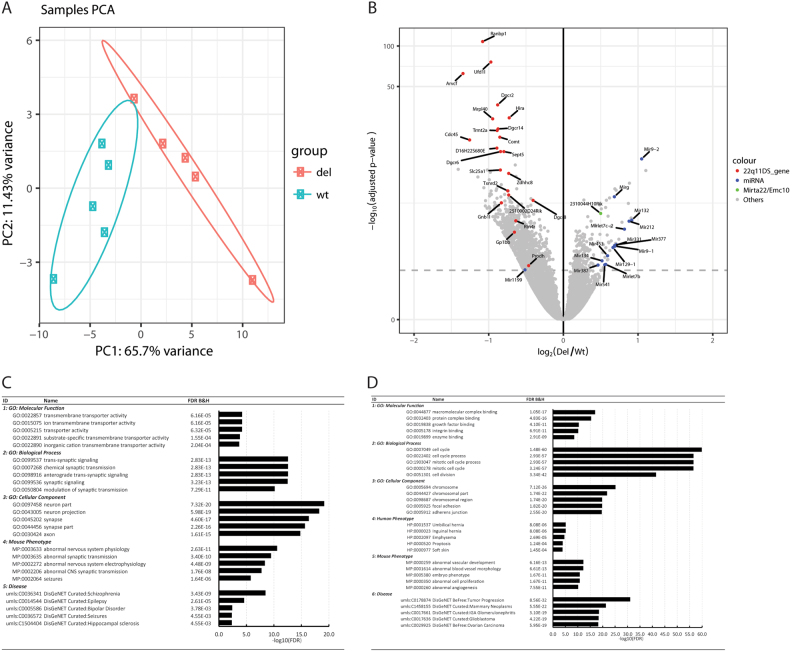
Fig. 5. Gene expression profile analysis of WT and Df(16)A+/− cortical neurons.
a PCA analysis indicates a good separation of the expression profiles between WT (green) and Df(16)A+/− (red) cortical neurons at DIV7. b Volcano plot indicating downregulation of the genes within the 22q11.2 deletion region and upregulation of primary miRNA genes and Mirta22/Emc10 as previous reported. c GO and phenotype analysis of significantly upregulated genes (FDR adjusted p < 0.05). d GO and phenotype analysis of significantly downregulated genes (FDR adjusted p < 0.05)

