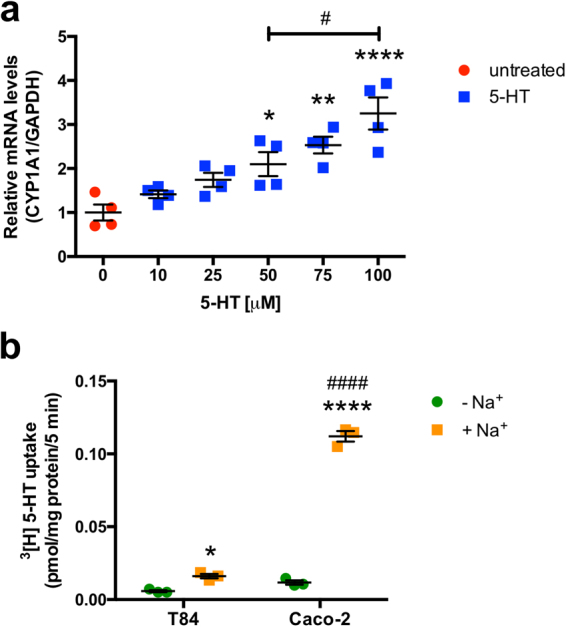
Figure 3.

Effect of 5-HT on CYP1A1 mRNA in T84 cells. (a) T84 cells were plated at low density and allowed to differentiate for 10–14 d in medium containing 5% serum before treatments were performed. T84 cells were treated for 24 h with 5-HT (10 μM–100 μM) in serum-free medium. Data represent the relative expression of CYP1A1 mRNA quantified by qPCR (n = 4). (b) T84 and Caco-2 cells were plated at low density and allowed to differentiate for 10–14 d in medium containing 5% or 20% serum, respectively. SERT function was measured in T84 and Caco-2 cells as3 [H]5-HT uptake in the presence or absence of Na+ (n = 3). Data were analyzed by 1-way (a) or 2-way (b) ANOVA followed by Tukey’s multiple comparison’s test. *P < 0.05, **P < 0.01, ****P < 0.0001 vs. no 5-HT or −Na+. #P < 0.05 and ####P < 0.0001 between groups. Red circle = untreated, blue square = 5-HT, green circle = −Na+, orange square = +Na+.
