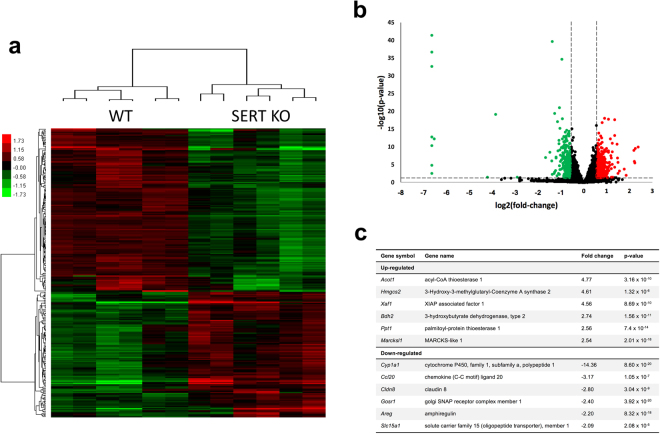
Figure 6.
Microarray gene expression analysis of SERT KO ileal mucosa. Gene expression in the ileal mucosa of 6 WT and 6 SERT KO mice was analyzed by microarray analysis as described in Methods. (a) Heat map showing the result of unsupervised hierarchical clustering of selected differentially expressed genes between WT and SERT KO. (b) Volcano plot showing the distribution of differentially expressed genes with cutoff criteria of log2|fold-change| ≥ 0.585 and a p-value < 0.05. Up-regulated genes shown in red and down-regulated genes shown in green. (c) List of selected genes that were significantly up-regulated or down-regulated in SERT KO mouse ileal mucosa. Full list of differentially expressed genes available at GEO (accession GSE93534).

