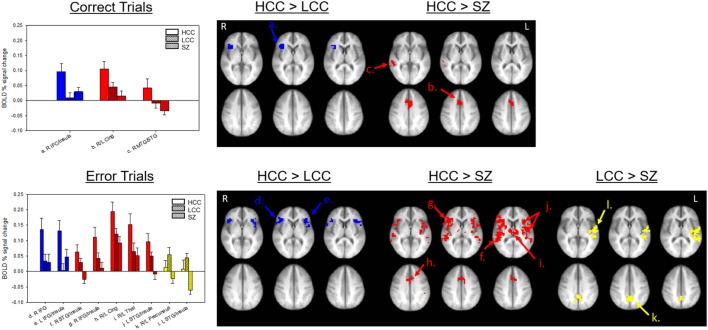
Figure 4.
Group-wise differences in antisaccade activation. Top panel shows group-wise differences in antisaccade correct trial activation. Bottom panel shows group-wise differences in antisaccade error trial activation. Bars (SE) show levels of activation for each group in each labeled cluster from Table 2. Clusters are shown on an anatomical image averaged across all subjects in Talairach space (top z = 2, 6, 10; bottom z = 31, 35, 39) I radiological orientation. Colors indicate in which comparison the cluster was significant. HCC, high cognitive control; LCC, low cognitive control; SZ, schizophrenia; IFG, inferior frontal gyrus; MTG, middle temporal gyrus; STG, superior temporal gyrus.

