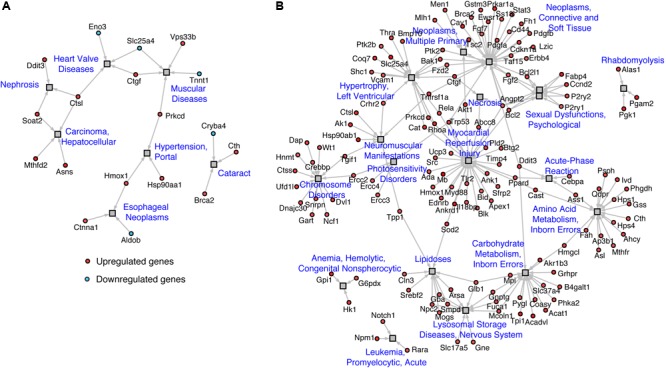
FIGURE 4.

Disease network of regulated genes identified in (A) WT vs. TazKD and (B) TazKD vs. TazKD-BF datasets. Rectangles and circles correspond to disorders and disease genes, respectively. A link is placed between a disorder and a disease gene if mutations in that gene lead to a specific disorder. Network is generated with AltAnalyze software interrogating the Comparative Toxicogenomics Database (http://ctdbase.org/).
