
Figure 1.
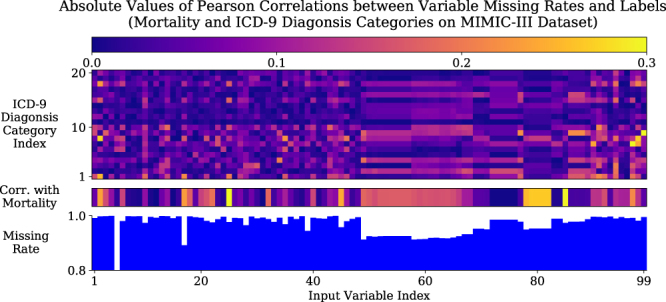
Demonstration of informative missingness on MIMIC-III dataset. The bottom figure shows the missing rate of each input variable. The middle figure shows the absolute values of Pearson correlation coefficients between missing rate of each variable and mortality. The top figure shows the absolute values of Pearson correlation coefficients between missing rate of each variable and each ICD-9 diagnosis category. More details can be found in supplementary information Section S1.