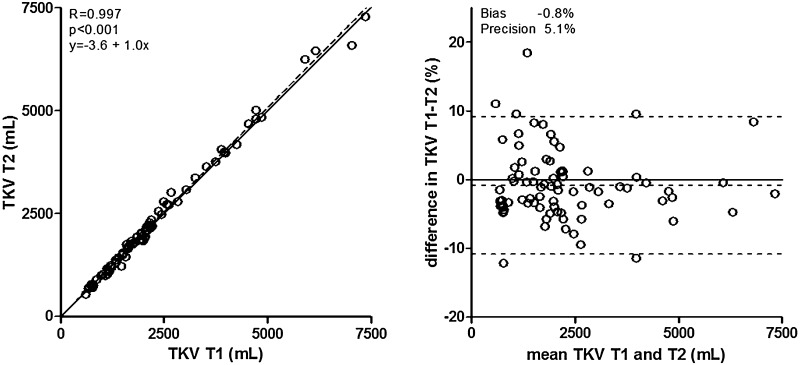
Fig. 2.
Cross-sectional associations of TKV measured using T1 or T2 weighted MR images. Left panel shows scatter plot, with solid line representing the line of identity, and dotted line the actual regression line. The right panel shows a Bland–Altman plot, with solid line representing no difference, and dotted line the actual mean difference (bias) with 95% confidence interval

