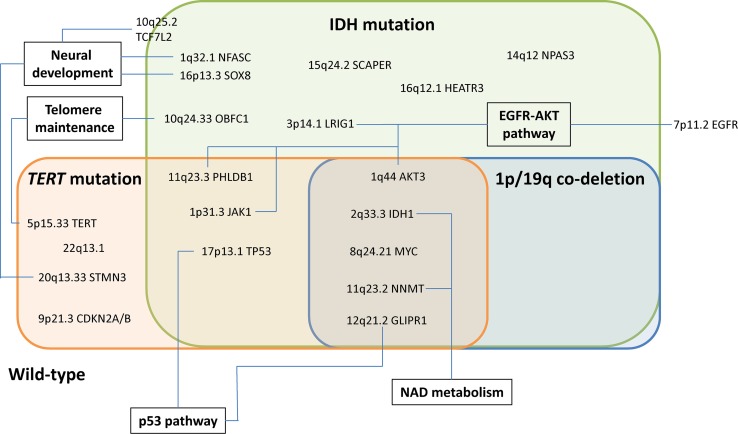
Fig. 3.
Summary of the relationship between glioma risk with molecular subgroup and associated biological pathways. The extent of the evidence supporting each candidate gene (ranging from an established role in glioma to largely speculative) is summarised in Table 3

