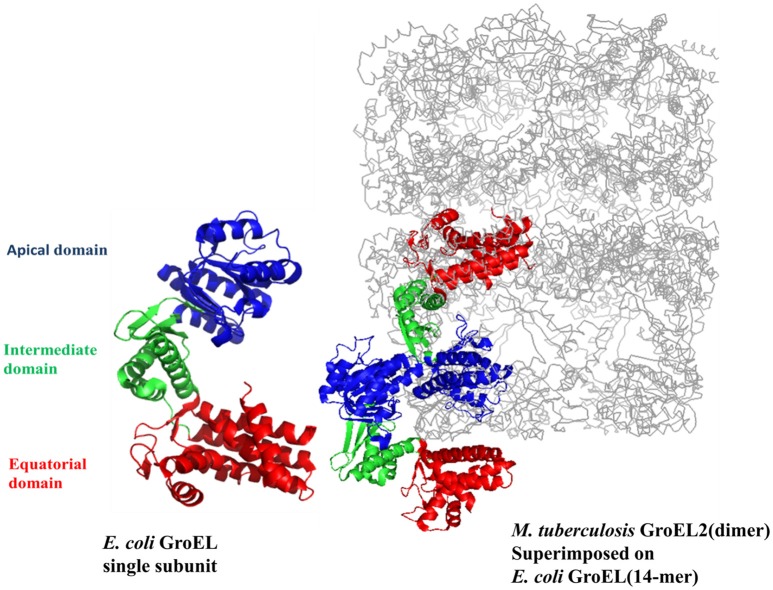
Figure 2.
The crystal structure of M. tuberculosis GroEL2 superimposed on E. coli GroEL-ES structure. The structure of M. tuberculosis GroEL2 (PDB ID:1SJP) shows lower oligomeric status (dimer). Colored in blue, green, and red are the Apical, Intermediate and Equatorial domain, respectively. Compared to E. coli GroEL (PDB ID: 1AON) shown in gray color, the inter-subunit interaction is mediated through Apical domain in M. tuberculosis GroEL2 structure whereas inter-subunit interaction is through Equatorial domain in E. coli GroEL. Single subunit of M. tuberculosis GroEL2 is aligned to E. coli GroES bound GroEL ring representing asymmetric model. GroES structure has been removed for simplicity. A single subunit of E. coli GroEL has been shown with the same color-coded domains compared to M. tuberculosis GroEL2 for comparative analysis. The PyMOL program (PyMOL Molecular Graphics System, version 1.3) was used to generate this figure.

