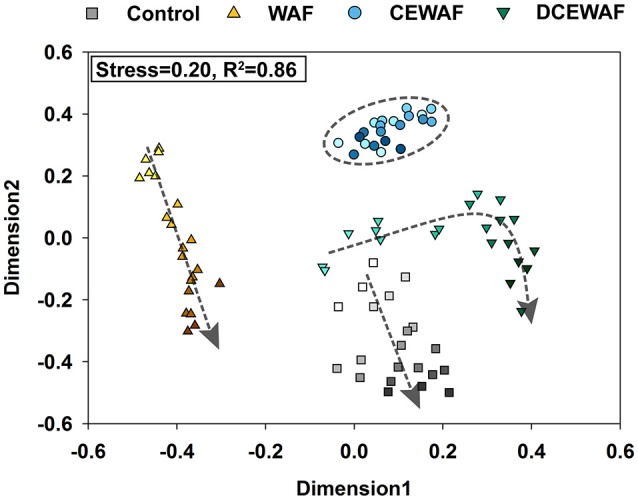
Figure 3.

NMDS plot of the shifts in the microbial community structure observed in the four mesocosm treatments. Darker colors represent later time-points for each treatment, which is further highlighted with the overlaid arrows, which indicate the direction of community succession over time.
