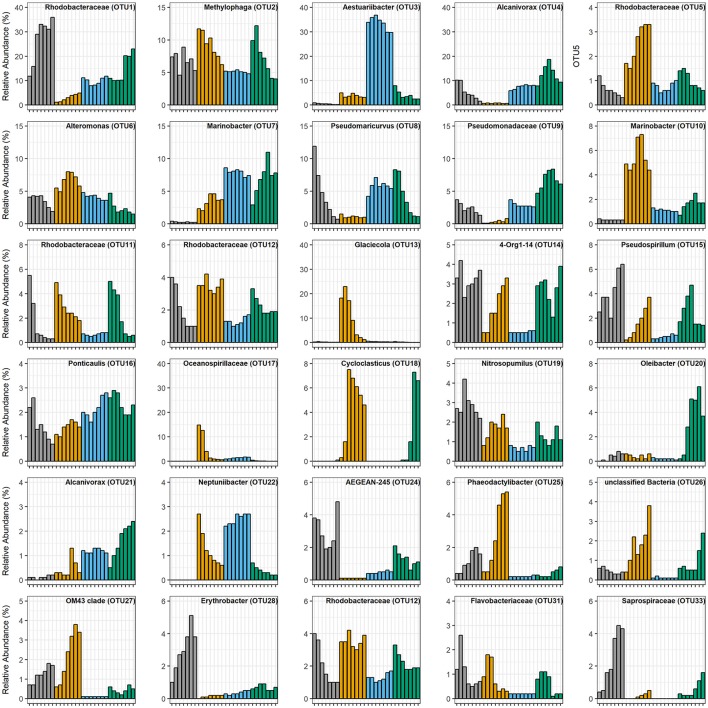
Figure 4.
Relative abundances of the 30 most abundant OTUs. Each bar is the average of triplicate treatments. Tick marks on the x-axes are the same as those in Figure 1, demarking each experimental time point, taken every 12 h. Color key is the same as Figure 1: gray is Control, orange is WAF, blue is CEWAF, and green is DCEWAF. When no data is presented, this reflects the absence of the OTU in that treatment.

