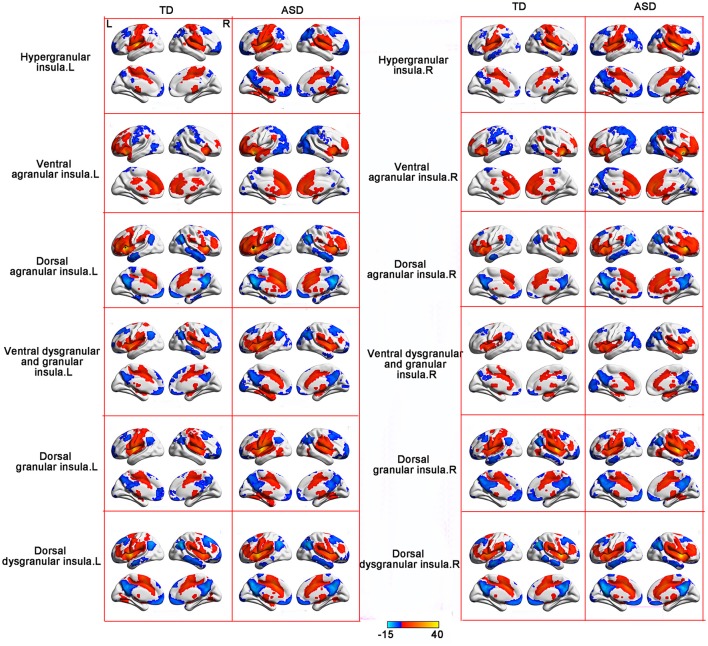
Figure 1.
RSFC patterns of the insular subregions in the ASD and TD groups. One sample t-tests were used to identify the group statistical maps. The significance level was determined with a voxel-level corrected threshold of p < 0.001 and a cluster-level corrected threshold of p < 0.05 using the Gaussian random field (GRF) corrections. The red and blue colors represent positive and negative functional connectivity with the seed regions.

