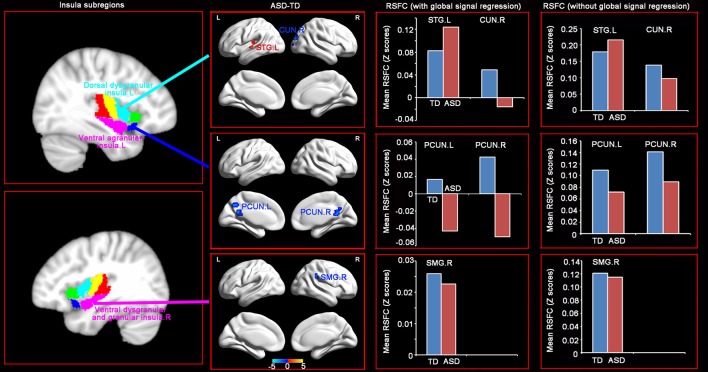
Figure 2.
Distinct RSFC patterns of the insular subregions in ASD. Two sample t-tests were used to identify the significant differences in functional connectivity between the ASD and TD groups with the age, gender, handedness, verbal IQs, performance IQs, and full-scale IQs as covariates. The significance was determined with a voxel-level corrected threshold of p < 0.001 and a cluster-level corrected threshold of p < 0.05 using the Gaussian random field (GRF) corrections. The red and blue colors represent increased and decreased functional connectivity respectively in the ASD group compared with the TD group. The results of mean RSFC with and without global signal showed similar patterns between the two groups.

