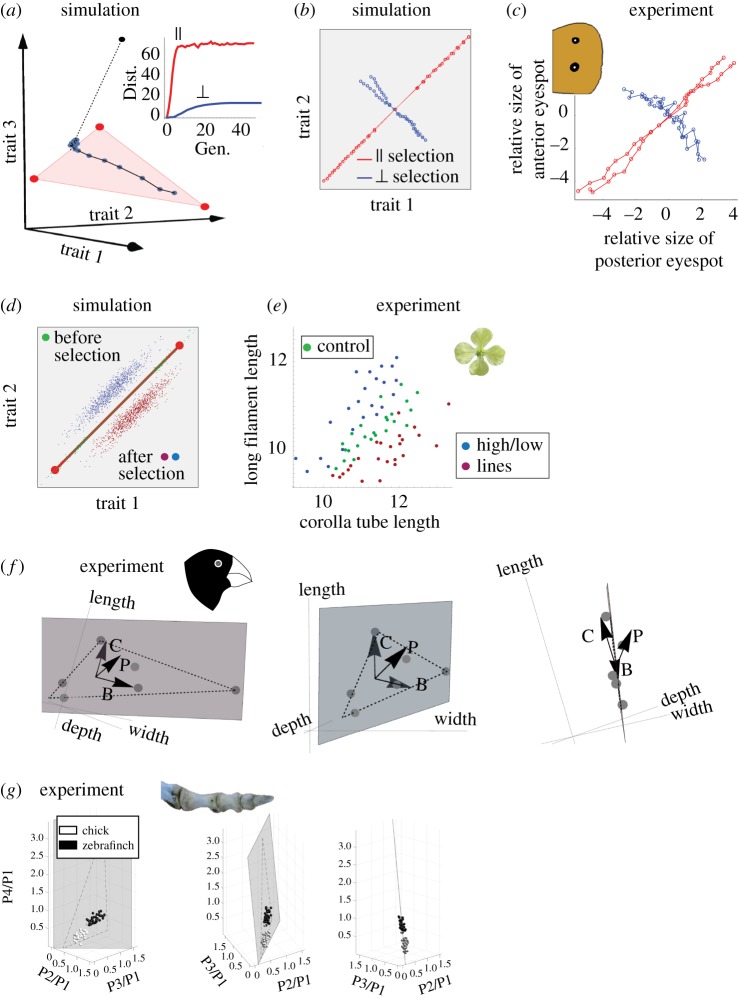
Figure 5.
Simulations on artificial selection and population variation agree with a range of experimental results (a) Response to selection towards a target off the front (black point) of an initial set of 100 phenotypes close to archetype 1 in a case of three tasks. The target is equally distant parallel and perpendicular to the front. Each blue point represents the mean phenotype in the population at time steps of one generation of selection towards the target with p = 0.1. The population rapidly evolves to the projection of the target on the plane of the triangle, followed by much slower evolution off the triangle. Inset: Parallel (red) and perpendicular (blue) distance from the initial population mean as a function of generation number. (b) Response to selection towards a distant target along front (red) and perpendicular to the front (blue). Each point represents the mean phenotype at subsequent generations of selection. Initial population was evolved for 10 000 generations with N = 100, μ = 0.5, k = 2, free-recombination, before artificial selection for another 10 generations. Artificial selection used p = 0.5. (c) Artificial selection experiments by Allen et al. [31] on butterfly eyespot-size show that the response along the main axis of phenotypic variation of the natural population is larger than the response to selection perpendicular to this axis. The axes are the normalized sizes of the two dorsal eye-spots, and the mean phenotype of the initial population is at the origin. Adapted from [31]. (d) Extended simulations of artificial selection perpendicular to the Pareto front results in a line parallel to the front. Initial population was same as in (b), artificial selection was performed for 100 generations. (e) Experiments by Conner on radish artificial selection perpendicular to the axis of natural variation result in mean offspring on a line (red, blue) parallel to the axis of natural variation (green). Adapted from [32]. Radish image is modified from https://commons.wikimedia.org/wiki/File:Wild_Radish_flower_(5360402586).jpg. (f) Normalized beak dimensions of Darwin's ground finch species fall approximately on a plane in the space of beak traits. Perturbations of the beak morphogen pathways, BMP, calmodulin and the premaxillary-bone modification factors denoted B, C and P in the figure, have phenotypic effects (arrows) approximately aligned with this plane (generated using data from [33]). See electronic supplementary material, §16 for details. Finch image is modified from https://commons.wikimedia.org/wiki/File:Sparrow_Beak.jpg (g) Phalanx proportions of different species of birds fall in a triangle. Populations of chickens and zebra-finches show variation aligned with this triangle. Adapted from [11]. Toe image is modified from [11].

