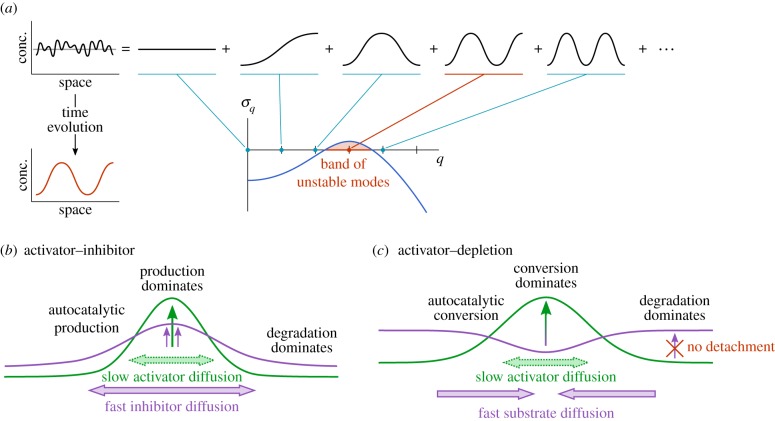
Figure 1.
Turing's general linear stability analysis and heuristic ad hoc interpretations in terms of the activator–inhibitor picture based on the production and degradation of reactants. (a) Any random perturbation (black line) of a spatially uniform state (grey line) can be decomposed into Fourier modes. Linear stability analysis yields the growth rates σq of the amplitude of all modes q. This is represented in the dispersion relation (blue line σq). Unstable modes (marked red) grow in amplitude and determine the pattern emerging out of the random perturbation during the incipient time evolution. (b) The activator–inhibitor model is based on autocatalytic production of a slowly diffusing activator, which in turn stimulates the production of a fast-diffusing inhibitor that suppresses autocatalytic activator production. Both activator and inhibitor are subject to degradation. The faster diffusion of the inhibitor leads to the formation of an inhibition zone in which degradation dominates over activator (and inhibitor) production. (c) In the activator–depletion model, the inhibitor is replaced by a substrate that is subject to degradation, and autocatalytic activator production is replaced by the autocatalytic conversion of substrate into activator. The rate of conversion is limited by the available substrate. Heuristically, this conversion could be equated with the attachment of cytosolic proteins to the membrane. However, the reverse process (detachment) is not taken into account. Both substrate and activator are steadily degraded and are produced at a finite rate. If the activator density is too low, the conversion process is suppressed and the degradation process dominates, as in the activator–inhibitor model.

