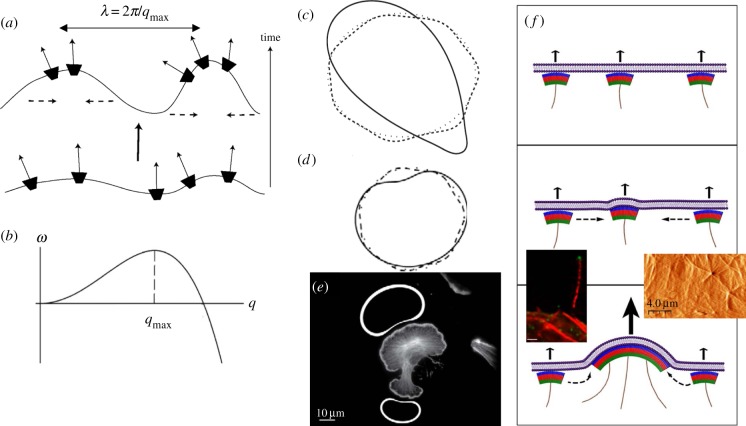
Figure 2.
(a) Positive feedback for convex CMC that recruit protrusive forces of the cytoskeleton (thin solid arrows) [34]. The convex CMC flow in the membrane to the tips of the protrusions (dashed arrows). From Gov & Gopinathan [34]. In the regime of instability, the most unstable wavelength grows the fastest, as shown in (b): rate of growth ω as function of the wavevector q = 2π/λ (λ is the wavelength). (c) In a numerical simulations [35], an initially round membrane contour (dotted line) spontaneously develops small protrusions (and associated accumulations of convex CMC) at the wavelength of the most unstable mode (dashed line), as predicted by the linear stability analysis (b). At longer times, nonlinear effects cause coarsening, whereby protrusions merge to form fewer and larger structures (solid line). (d) Evolution of a membrane when driven by the recruited forces of actin polymerization (line scheme as in (c)). The final steady-state shape at long times is in the form of a fan-shaped membrane [35], with the convex CMC (and actin polymerization) spread along the convex parts, and absent (or greatly depleted) from the concave part. (e) The fan-shape steady-state solution of (d) agrees with the observed distribution of actin polymerization in lamellipodia of cells [35], where the actin is fluorescently labelled, and the calculated accumulation of CMC on the membrane is indicated by the thickness of the white line for the two fan-shaped steady-state contours (above and below the cell image). (c)–(e) From Kabaso et al. [35]. (f) Illustration of the process of aggregation of HIV viral coat complexes on an infected cell membrane [58]. The arrows indicate the protrusive force due to the actin polymerization (solid purple lines), which is recruited by the viral coat protein complexes (green–red–blue arcs). The bottom left panel shows a fluorescent image of a long cellular protrusion containing actin (red) and viral coat proteins at the tip (green). The bottom right panel shows an image of the height of the membrane (using atomic force microscopy (AFM)) during viral budding, where actin cables can be seen emerging from the budding sites. From Gladnikoff et al. [58].

