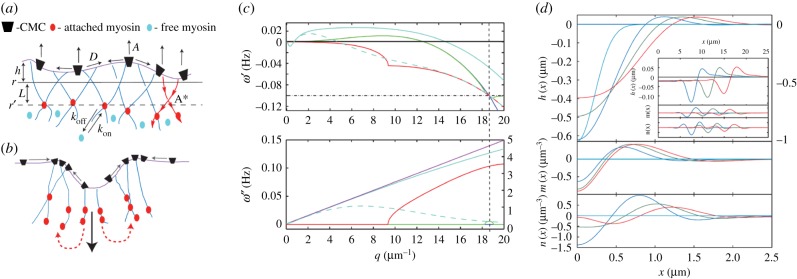
Figure 4.
(a) Schematic description of the model [116] with convex CMC that recruit actin polymerization (A), which in turn adsorbs myosin motors from the cytoplasm (equation (5.2)) that give rise to inwards contraction (A*, equation (5.1)). (b) Strong contraction (large downward black arrow) leads to CMC aggregation on the two sides (small arrows on the membrane), followed by the motors (dashed red arrows), leading to wave propagation sideways. (c) The evolution of the dispersion relation ω(q) as function of the myosin contractile strength A*. The case of A* = 0 is in dark blue, while the green, red and light blue show increasing values of A*. For the largest value the calculated analytical linear dispersion approximation is plotted in purple. The vertical dashed line denotes the wavevector at which waves first appear (qω). The horizontal dash-dotted line indicates the rate of myosin detachment koff (see (a), equation (5.2)). The dashed light blue lines give the dispersion using a non-local myosin force kernel (for details see [116]). (d) One-dimensional simulation using our linearized model (without thermal noise), showing the formation of moving waves due to sudden perturbation in the membrane shape. We plot here the membrane height h(x), myosin m(x) and actin n(x) density fluctuations as a function of position and time; t = 0, 1, 2, 3 s (light blue, blue, green and red). Note that for the height profile at t = 0 use the right-hand scale. In the inset, we show the waves propagating at longer times; t = 60, 90, 120 s (blue, green and red). (All the panels from [116]).

