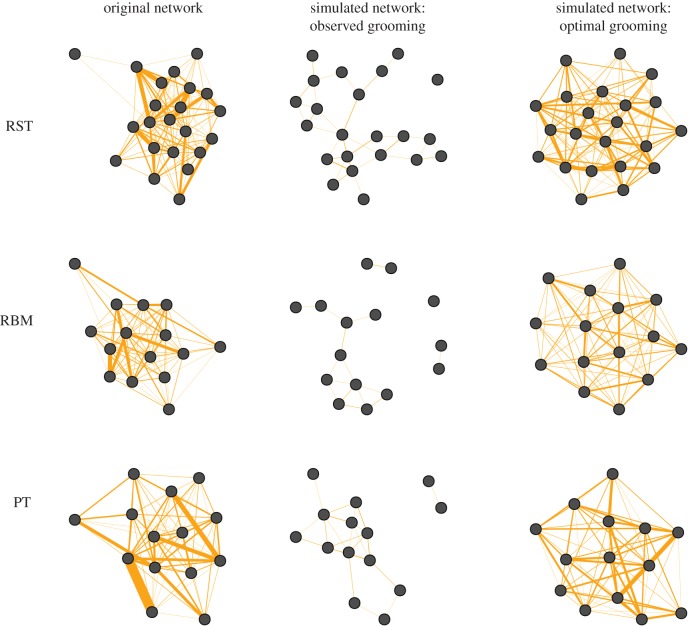
Figure 3.
Visual comparison of the observed weighted networks of the three troops (time block 7) alongside the networks predicted after 500 removals and replacements, using either the grooming allocations derived from observations or those derived from optimizing grooming allocations to stabilize the network. (Online version in colour.)

