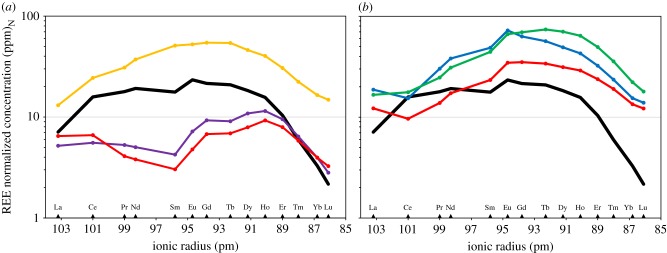
Figure 2.
(a) PAAS normalized REE profiles of fossil bioapatite from the Aptian–Albian of Gadoufaoua, Niger. Concentrations are plotted on a logarithmic scale. Plain black line, typical REE profile at Gadoufaoua; yellow line, exotic profile of sample GCA5; purple line, exotic profile of sample GSA7; red line, exotic profile of sample GSP3. (b) PAAS normalized REE profiles of fossil bioapatite from the Cenomanian of Kem Kem Beds, Morocco. Concentrations are plotted on a logarithmic scale. For comparison, the plain black line represents the typical REE profile at Gadoufaoua; yellow line, typical profile of samples from the locality of Jebel Al Qabla; blue line, typical profile of samples from the locality of Bou Laâlou; red line, typical profile of samples from the locality of Takemout.

