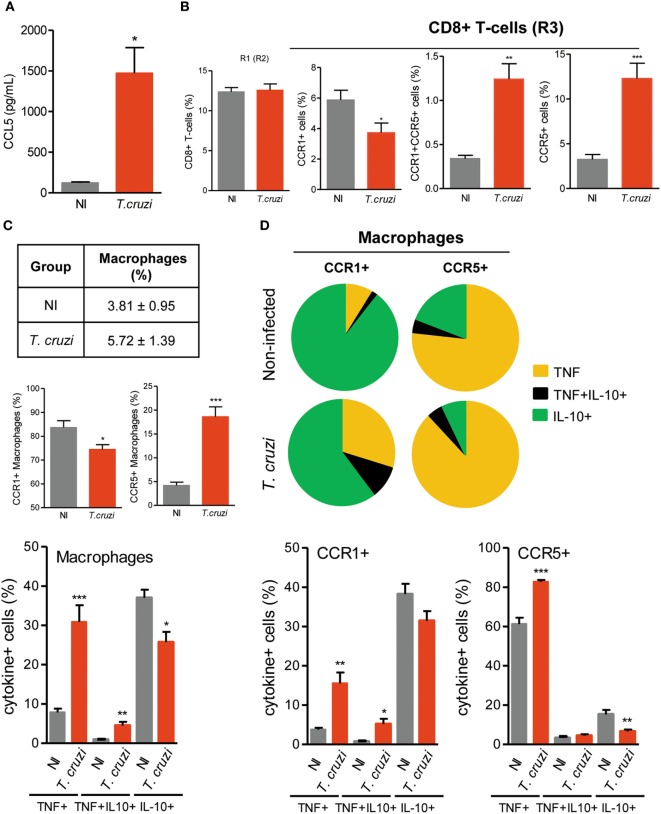
Figure 2.
CCL5 levels and CCR1 and CCR5 expression in CD8+ T cells and CD14+ macrophages of T. cruzi-infected C57BL/6 mice. Mice were infected with 100 trypomastigote forms of the Colombian T. cruzi strain and analyzed at 120 days postinfection. The heart was removed, proteins were extracted, and CCL5 concentrations were estimated by enzyme-linked immunosorbent assay. Splenocytes were collected and stained for intracellular cytokines (TNF, IL-10) and surface cell markers (CD8, CD14, CCR1, CCR5). (A) CCL5 levels in the heart tissue extracts of T. cruzi-infected mice compared to noninfected (NI) controls. (B) Percentages of total CD8+ T cells and CD8+ T cells expressing CCR1 and/or CCR5 in the spleen of NI and T. cruzi-infected mice. (C) The table shows percentages of total CD14+ macrophages. Graphs show the frequencies of CD14+ macrophages expressing CCR1 or CCR5 and CD14+ macrophages expressing TNF, TNF/IL-10, or IL-10 in the spleen of NI and T. cruzi-infected mice. (D) Pie charts represent the fractions of CCR1+ or CCR5+ CD14+ macrophages carrying each of the intracellular cytokine phenotypes shown in the legend. Graphs show the frequencies of CCR1+ or CCR5+ CD14+ macrophages expressing TNF, TNF/IL-10 or IL-10. Data represent two independent experiments with three NI and five to seven infected mice [*P < 0.05, **P < 0.01, ***P < 0.001, T. cruzi-infected mice vs NI (Student’s t-test)].

