
FIGURE 1.
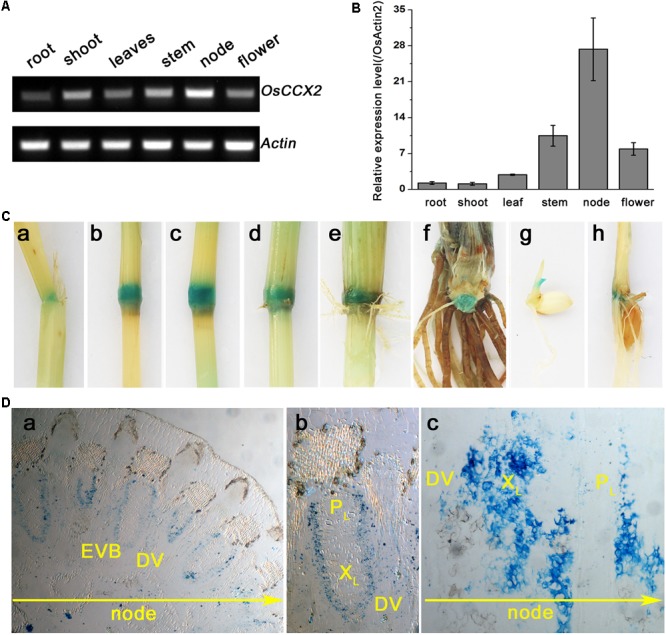
Tissue expression pattern analyses of OsCCX2. (A) The semi-quantitative-RT-PCR analysis of OsCCX2 transcript levels. Data are representative values of three independent experiments. (B) The q-PCR analysis of OsCCX2 transcript levels in diverse tissues. Data are average values of three independent experiments and are presented as mean ± SD. (C) Histochemical GUS staining of OsCCX2 pro:GUS plants. (a–f) The maturation plant grown on soil. (a) The leaf sheath. (b) Node I. (c) Node II. (d) Node III. (e) Node IV. (f) Unelongated basal stem. (g) Four-day-old seedling grown on MS agar plates. (h) Two-week-old seedling grown in hydroponics. (D) Paraffin section of Node I. The GUS signal is shown in blue. (a) Cross slice of Node I. (b) Enlarged image of an EVB and a DVB in (a). (c) Longitudinal slice of Node I. Bar = 200 μm.