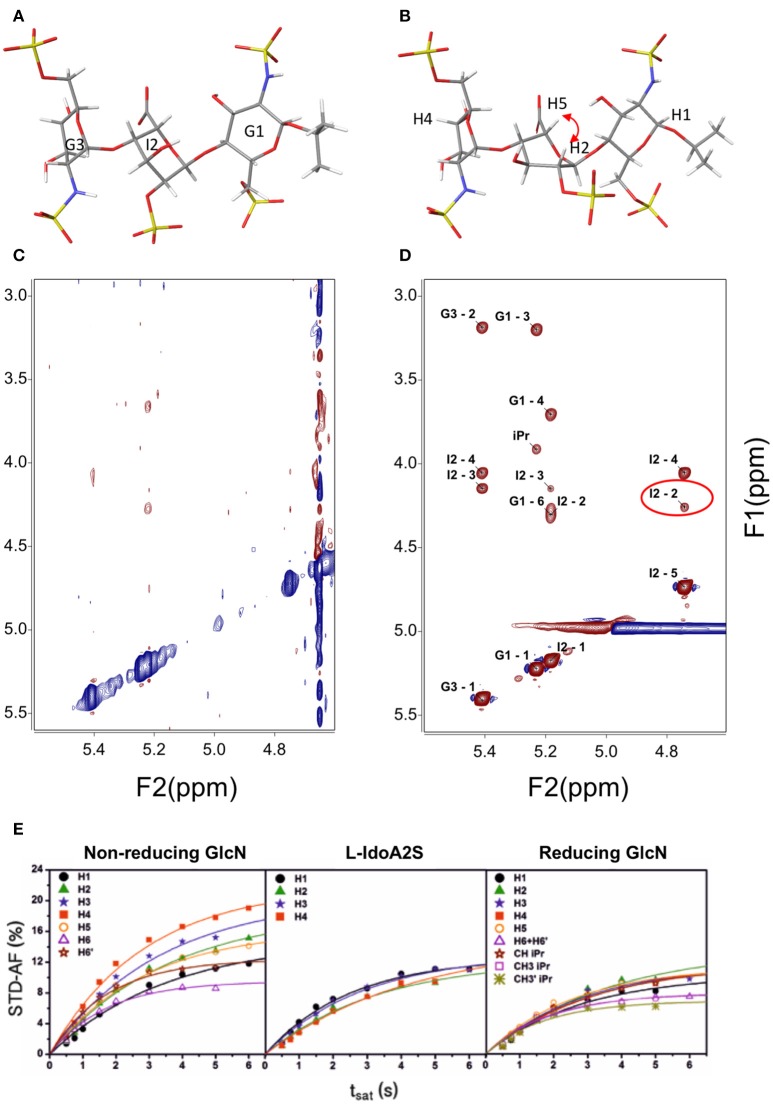
Figure 1.
Structure of a heparin trisaccharide with the central iduronate in: (A) 1C4 and (B) 2SO conformation; (C) NOESY 500 MHz and 600 ms tmix; (D) transfer NOESY (800 MHz, 200 ms tmix)—the labels correspond to the assignment of cross-peaks—notice the peak I2 H2—H5, a NOESY peak exclusive to the 2SO conformation; and (E) STD—affinity factor growing curves for the extraction of the initial rates for quantitative analysis (Muñoz-García et al., 2015).

