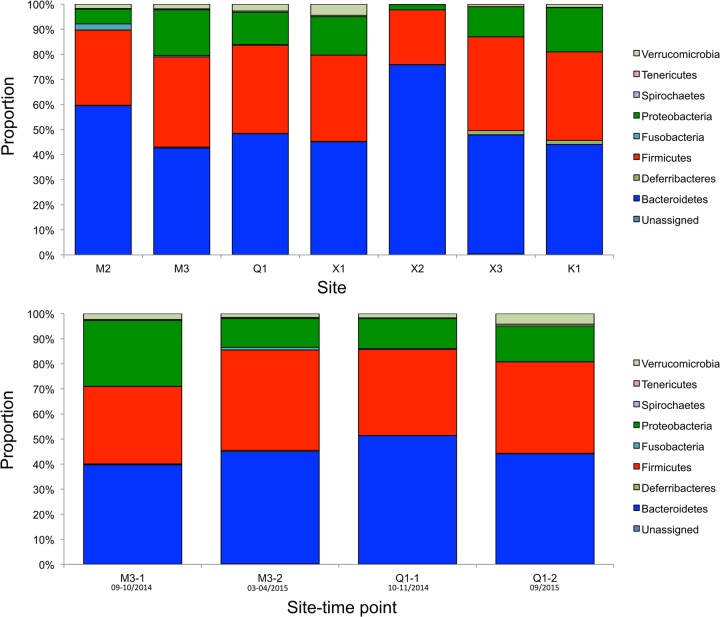
FIG 2 .
Bacterial phyla of wild house mice in New York City. Histograms represent the average proportion of operational taxonomic units that were assigned to bacterial phyla from all samples from the same site or time point. (Top) Comparison of the fecal microbiomes from seven sites. (Bottom) Variation in fecal microbiome compositions between two time points at two sites. Month/year of collection is provided under each site-time point.

