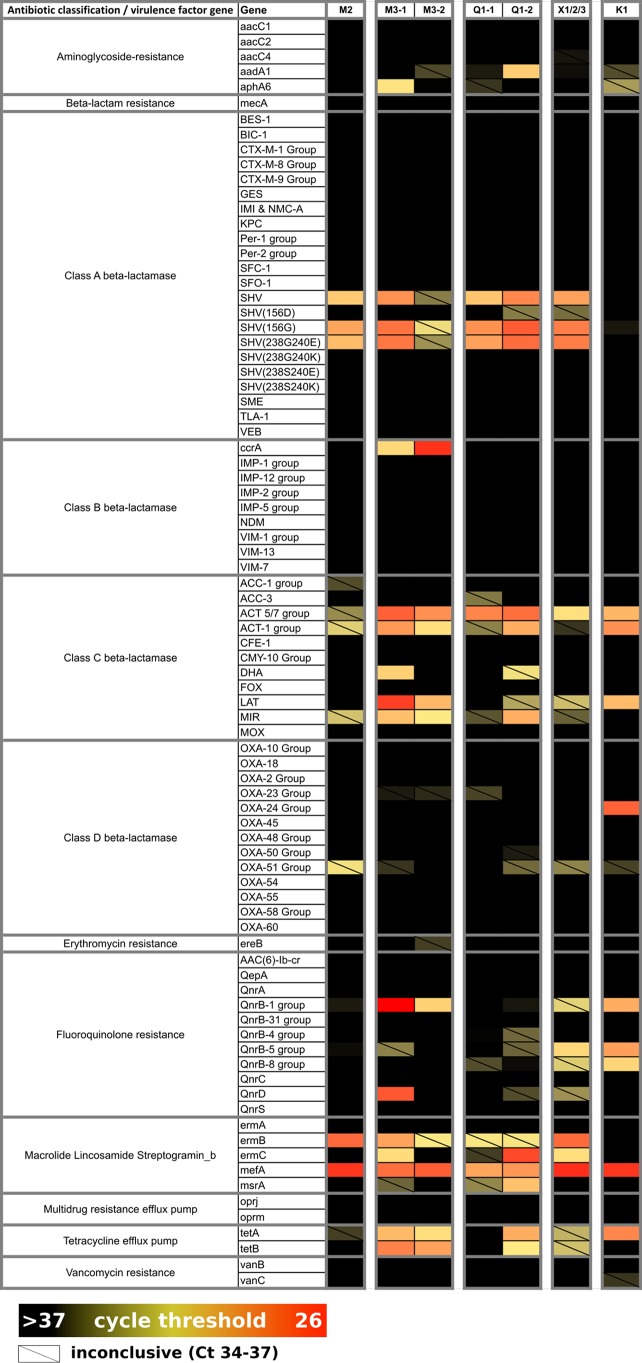
FIG 4 .
Antimicrobial resistance profiles from house mouse fecal contents in New York City. Cells are colored according to the intensity of the qPCR cycle threshold, where a lower value (red) indicates a higher concentration of the target gene, relative to other samples for the same assay. All CT values of >37 were considered negative (black), and CT values between 34 and 37 were recorded as inconclusive (diagonal slash).

